
- The US Dollar Index (DXY) retraces some of Wednesday’s sharp rally above 105.00.
- The March low near 103.50 should contain the decline so far.
The US Dollar Index (DXY) loses some of the strong gains on Wednesday and falls back to the 104.50 area on Thursday.
If the bulls regain control, the index could challenge the 2023 high at 105.88 (March 8) on the near-term horizon before the 200-day SMA, today at 106.64.
On a bigger picture, as long as it stays below the 200-day SMA, the outlook for the greenback will remain negative.
DXY daily chart
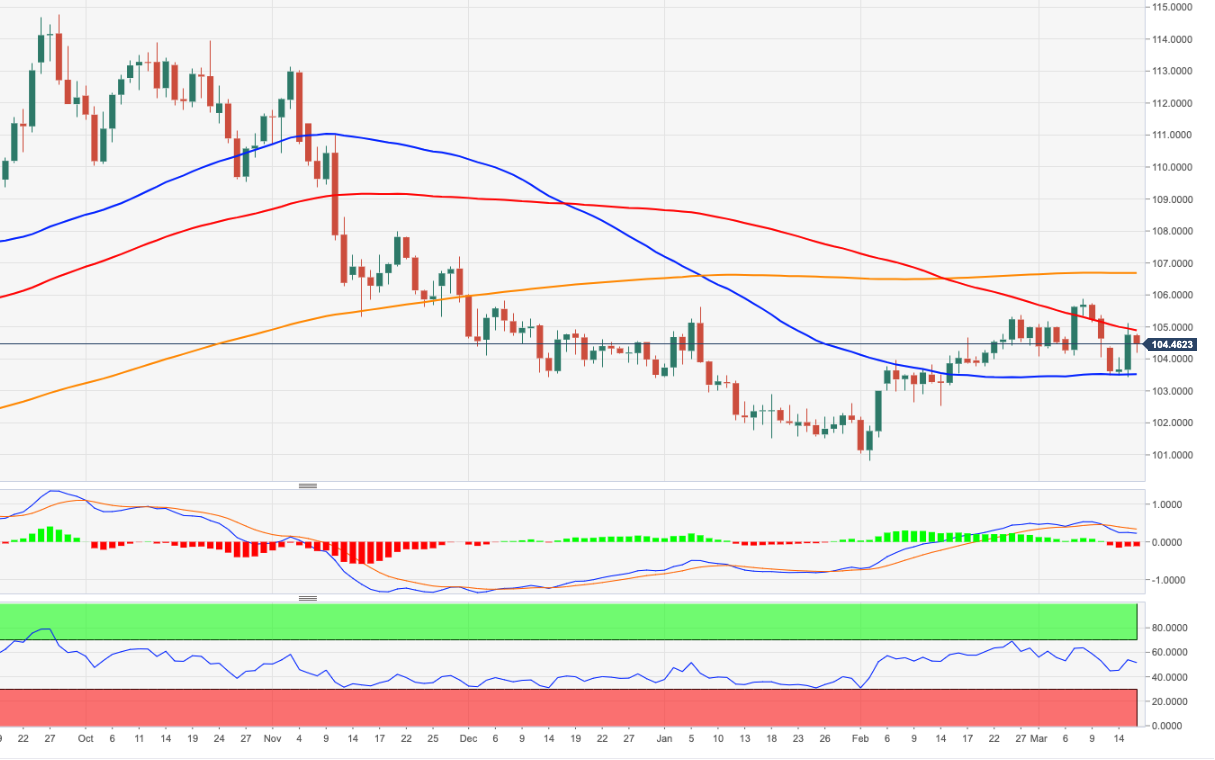
Source: Fx Street
I am Joshua Winder, a senior-level journalist and editor at World Stock Market. I specialize in covering news related to the stock market and economic trends. With more than 8 years of experience in this field, I have become an expert in financial reporting.


