
- The US Dollar Index has been trading in a bullish channel for several months.
- After touching the top of the channel, it reversed its trajectory and began to fall towards the bottom line of the channel.
- The price is close to the support and the RSI is oversold, indicating a probable pause in the bearish movement.
The price of US Dollar Index (DXY) It is falling within a several-month-long bullish channel after hitting the top line of the channel and turning around.
Since the price tends to oscillate within a channel, the Dollar Index is probably in the middle of a bearish leg, meaning there is a good chance that it will continue falling to the lower dividing line before bouncing and resuming its uptrend. .
US Dollar Index 4-hour chart
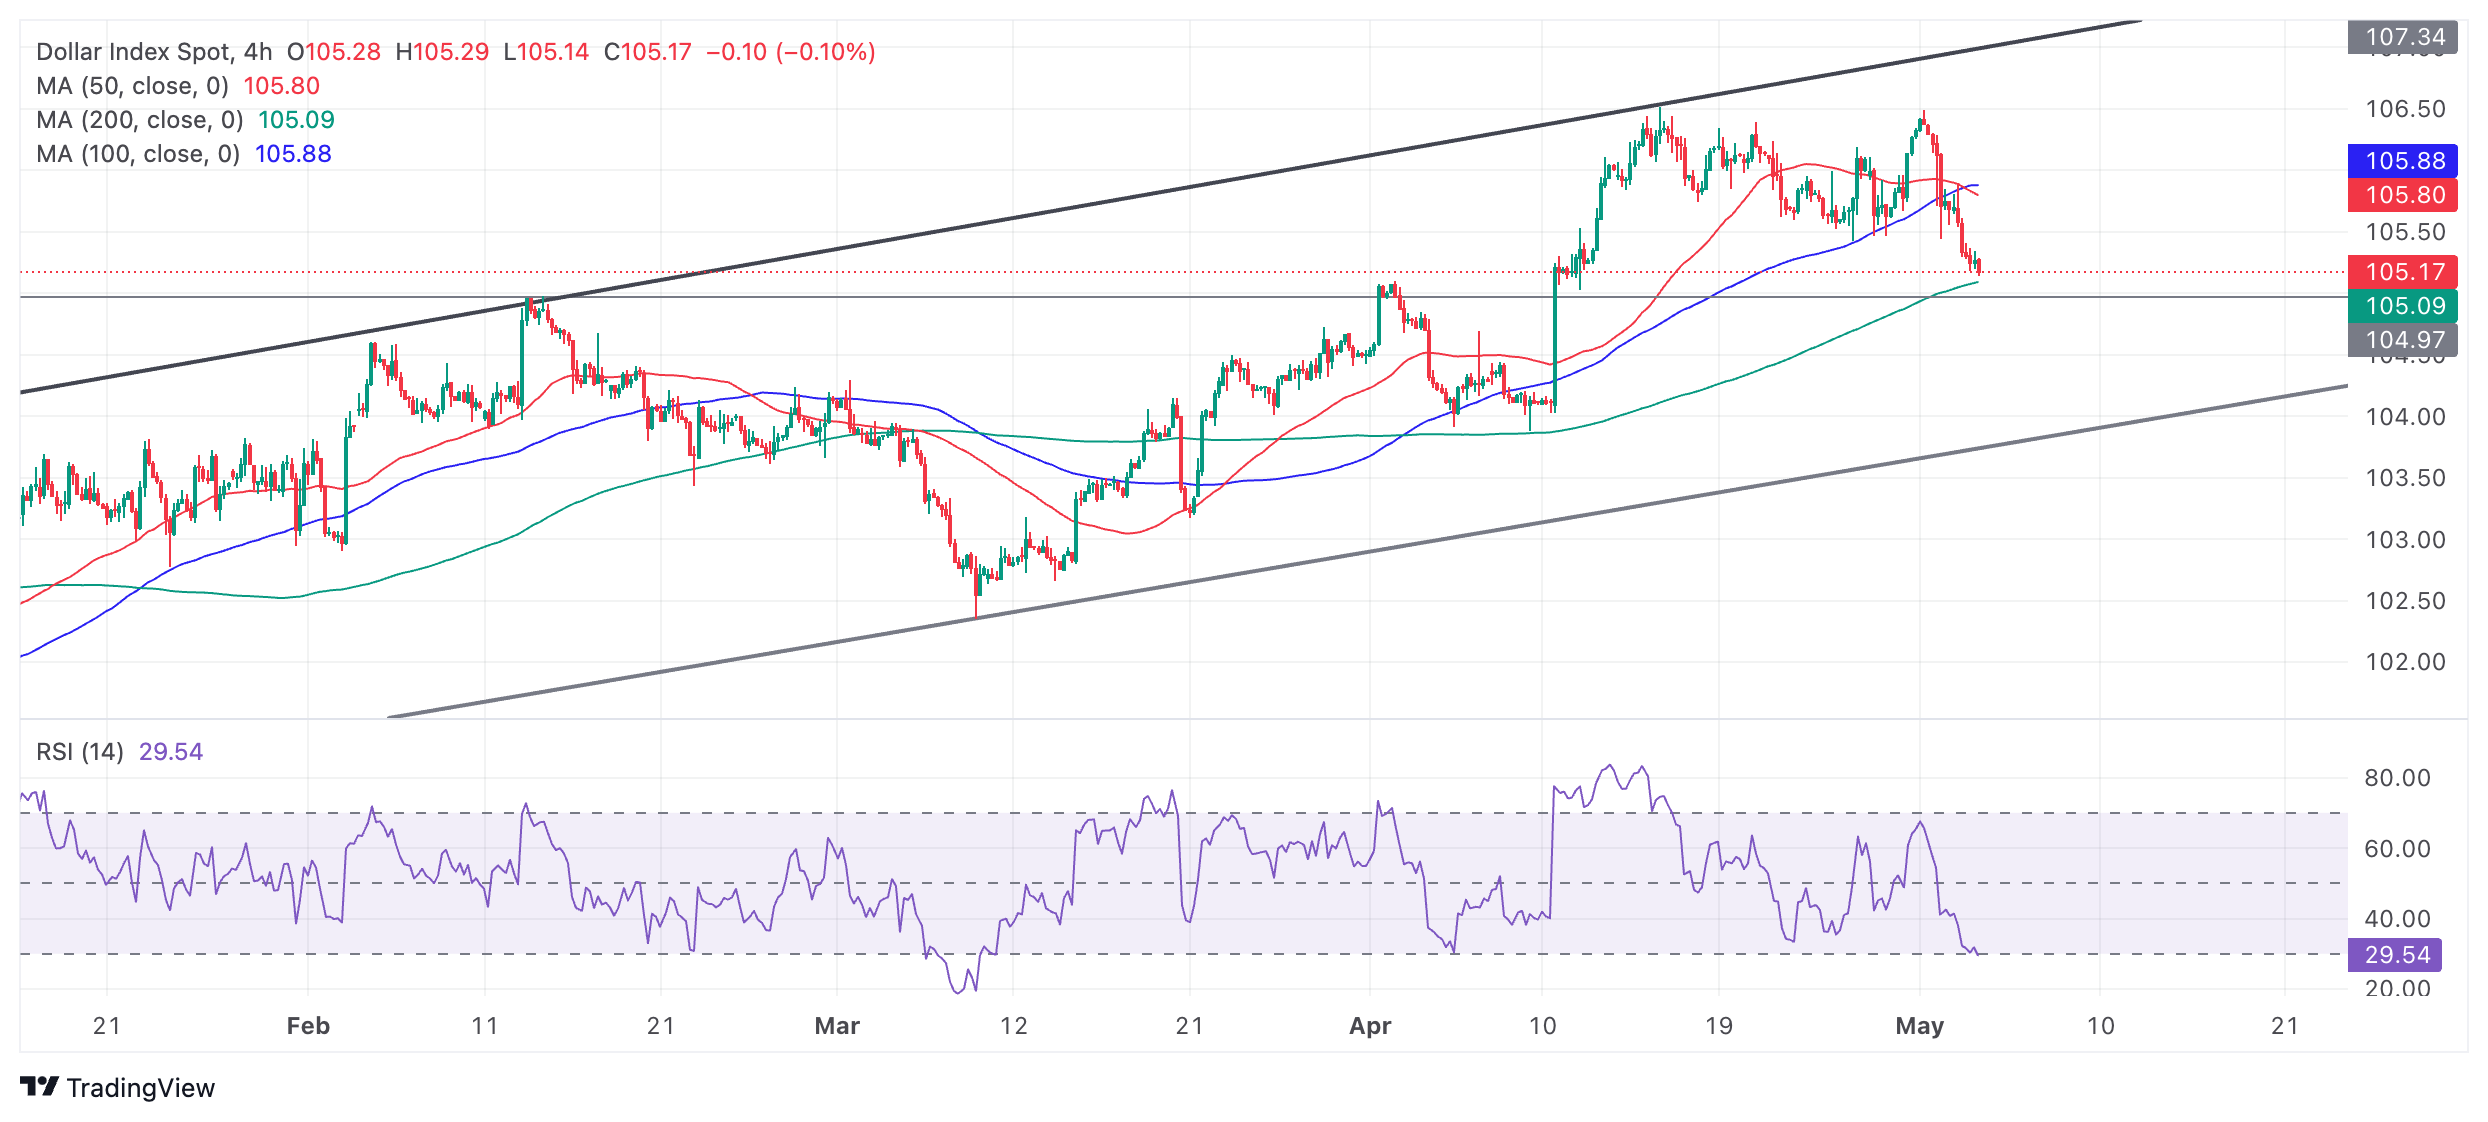
The price of the Dollar Index is falling near solid support at 104.97 made up of several old peaks that occurred at that point. The green 200 simple moving average (SMA) is also nearby at 105.09 and likely offers support.
The probability that the price could find a bottom is increased by the fact that the RSI is potentially signaling oversold – depending on the current bar close. If it does, this will indicate a higher probability that the price can find a bottom and consolidate. When the RSI goes into oversold it is a signal for traders not to increase their short positions.
A decisive break below the 104.97 support level would signal a downward continuation towards a possible target at the lower channel line, at that point, near 104.00.
Source: Fx Street
I am Joshua Winder, a senior-level journalist and editor at World Stock Market. I specialize in covering news related to the stock market and economic trends. With more than 8 years of experience in this field, I have become an expert in financial reporting.

.jpg "Intimate video stolen from Stefano De Martino and Caroline Tronelli: suspicions about a camera technician")


