
- The DXY maintains the recovery and approaches 102.70.
- Further gains are now targeting the 103.00 area in the near term
He DXY manages to reverse the initial pessimism well and recover the smile in the vicinity of the 102.70 area on Tuesday.
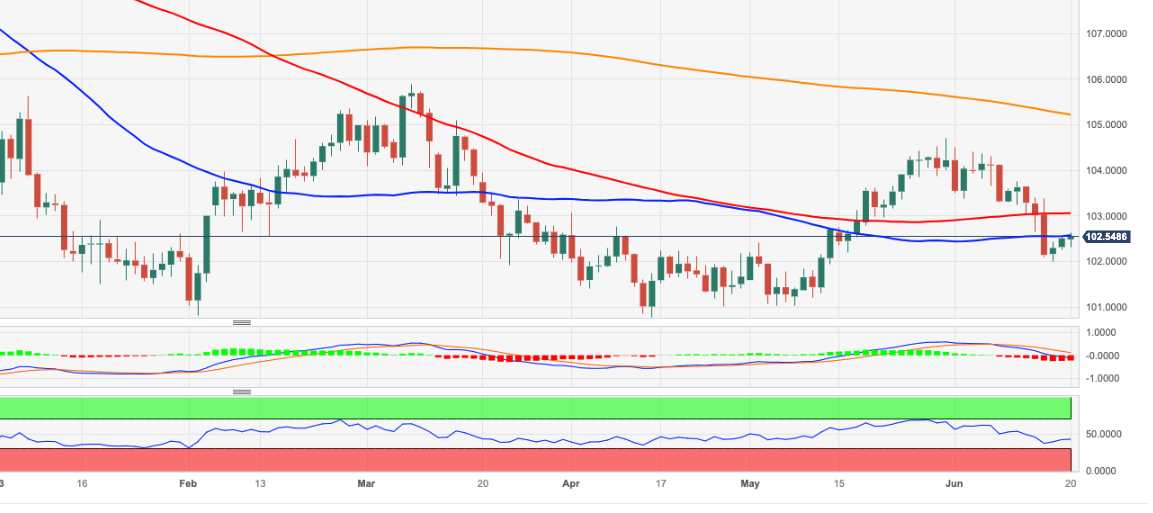
Immediately to the upside, the DXY faces the next hurdle at the round 103.00 level, which looks bolstered by the approach of the transient 100-day SMA. The DXY could see its bearish pressure mitigated once this zone is broken convincingly.
On a bigger picture, as long as it holds below the 200-day SMA at 105.21 the outlook for the index will remain negative.
DXY daily chart
Source: Fx Street
I am Joshua Winder, a senior-level journalist and editor at World Stock Market. I specialize in covering news related to the stock market and economic trends. With more than 8 years of experience in this field, I have become an expert in financial reporting.


