
- The index resumes the downtrend and revisits the 105.30 zone.
- The loss of the 200-day SMA opens the door for further losses.
The Dollar Index (DXY) comes under additional selling pressure and prolongs the break of the key 106.00 barrier at the start of the week.
Selling pressure prompts the index to flirt with the ever-relevant 200-day SMA, today at 105.36. A drop below the latter is expected to accelerate losses and target the August low at 104.63 (August 10).
Below the 200-day SMA, the outlook for the index should shift to bearish.
DXY daily chart
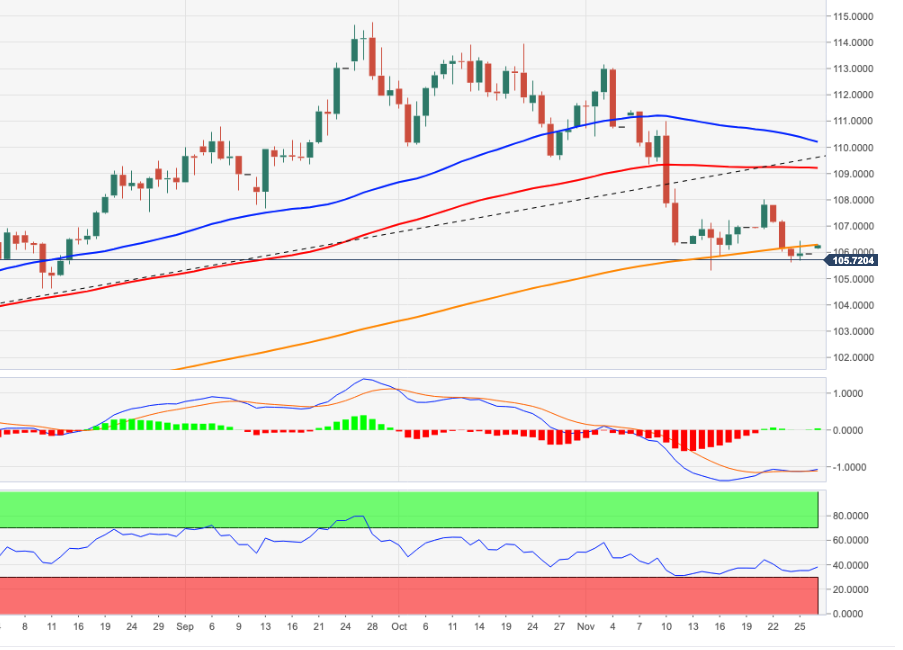
Source: Fx Street
I am Joshua Winder, a senior-level journalist and editor at World Stock Market. I specialize in covering news related to the stock market and economic trends. With more than 8 years of experience in this field, I have become an expert in financial reporting.


