
- The US Dollar Index (DXY) remains close to 112.00.
- Loss of the 111.50 area could trigger a deeper pullback.
The US Dollar Index (DXY) moderate the optimism seen earlier in the week and pulls back to the 112.00 area, where it is now attempting to consolidate.
If the index falls below recent lows near 111.50 (Oct 24), sellers could then try to challenge the October low near key support at 110.00 (Oct 4.5).
Prospects for further dollar gains should remain unchanged as long as the index trades above the 8-month support line near 108.30, an area that coincides with the 100-day SMA.
In the longer term, DXY is expected to maintain its constructive stance as long as it is above the 200-day SMA at 103.86.
DXY daily chart
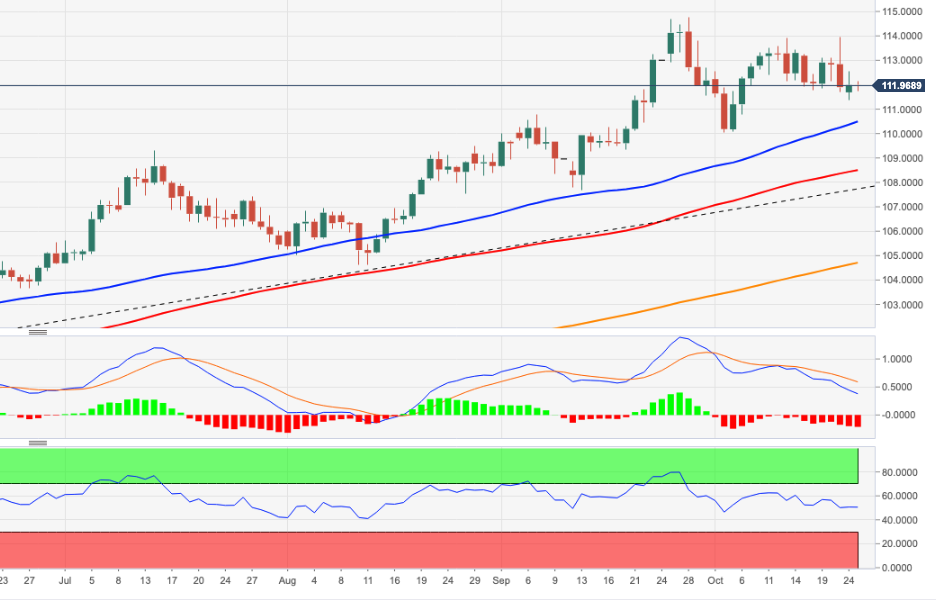
Source: Fx Street
With 6 years of experience, I bring to the table captivating and informative writing in the world news category. My expertise covers a range of industries, including tourism, technology, forex and stocks. From brief social media posts to in-depth articles, I am dedicated to creating compelling content for various platforms.


