
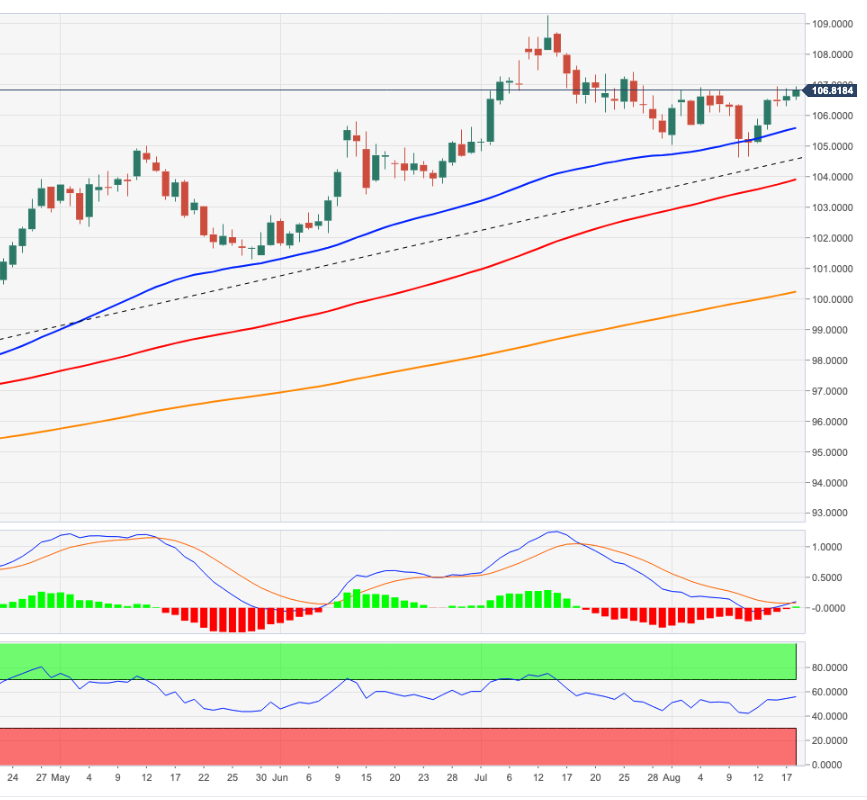
- The US Dollar Index (DXY) adds to Wednesday’s rally and heads back to 107.00.
- Above 107.00 the index could revisit the weekly high at 107.42.
The US Dollar Index (DXY) extends the gains for the second consecutive session on Thursday, although at the moment it remains difficult to test the 107.00 area.
The continuation of the bullish momentum could extend to the August high near the 107.00 mark (Aug 5). Breaking above this level should prompt the index to challenge the post-FOMC meeting high at 107.42 (July 27).
In a broader scenario, the bullish view of the dollar remains above the 200-day SMA at 100.28.
DXY daily chart
Technical levels
Source: Fx Street
With 6 years of experience, I bring to the table captivating and informative writing in the world news category. My expertise covers a range of industries, including tourism, technology, forex and stocks. From brief social media posts to in-depth articles, I am dedicated to creating compelling content for various platforms.


