
- The index extends weekly optimism beyond 105.00.
- Immediately to the upside is the 200-day SMA.
The US dollar index (DXY) adds to Thursday’s bounce and breaks above the key 105.00 barrier by the end of the week.
The dollar is trading at multi-week highs north of the 105.00 barrier and the current bullish momentum allows for continuation of the bullish bias for now. Conversely, the next target to watch lies at the 200-day SMA, today at 106.32.
Below it, the outlook for the index should remain negative.
DXY daily chart
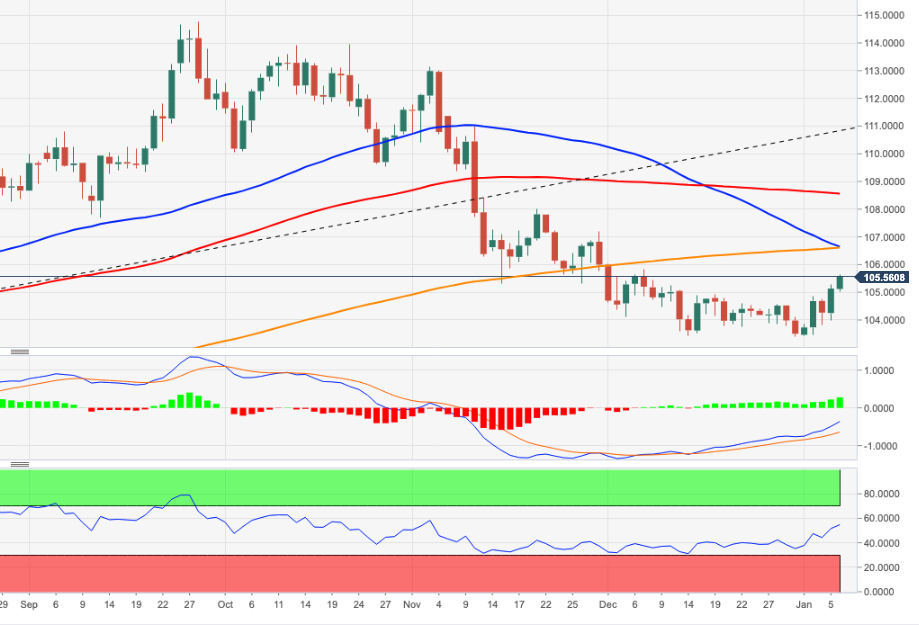
Source: Fx Street
I am Joshua Winder, a senior-level journalist and editor at World Stock Market. I specialize in covering news related to the stock market and economic trends. With more than 8 years of experience in this field, I have become an expert in financial reporting.


