
- The DXY reverses Monday’s negative trend and retests 106.50 points.
- If it continues to advance, it could revisit the 106.80 area in the short term.
He DXY manages to regain its balance and advance to the 106.50 area on Tuesday.
Considering the ongoing price action, breaking the weekly high of 106.78 (Oct 12) could encourage DXY to embark on a potential test of the 2023 high of 107.34 (Oct 3) on the near-term horizon.
Meanwhile, as long as it remains above the key 200-day SMA, today at 103.23, the outlook for the index is expected to remain constructive.
DXY Daily Chart
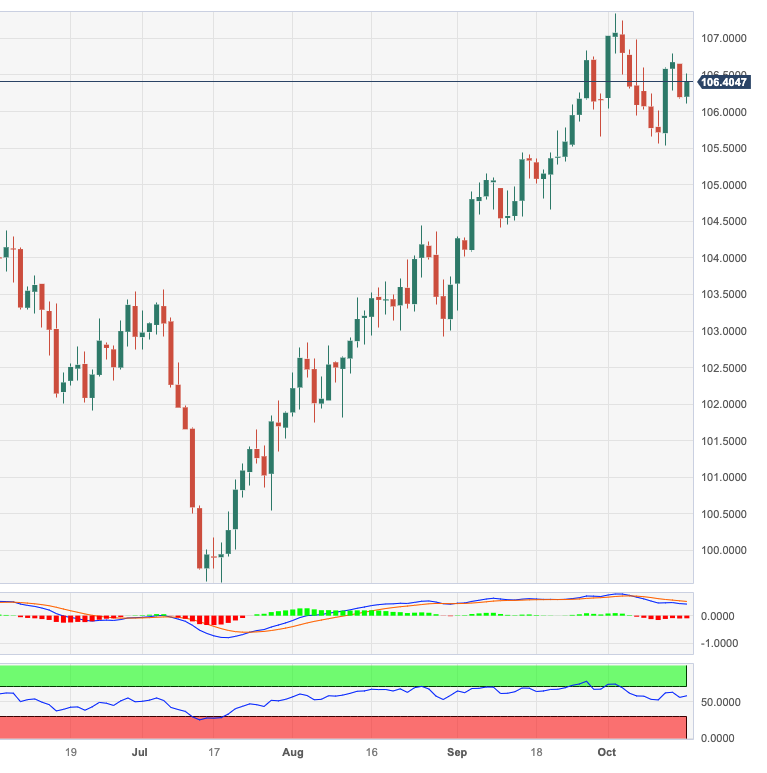
Source: Fx Street
I am Joshua Winder, a senior-level journalist and editor at World Stock Market. I specialize in covering news related to the stock market and economic trends. With more than 8 years of experience in this field, I have become an expert in financial reporting.


