
- The DXY rebounds strongly and recovers the 106.00 area.
- Higher up is the next bullish barrier near 106.80.
He DXY regain composure and reclaim the zone beyond the 106.00 hurdle on Tuesday.
It seems that the DXY is still trading in a consolidation phase for the moment. Meanwhile, occasional bullish attempts continue to target the weekly high of 106.78 (Oct 12) ahead of the 2023 high of 107.34 (Oct 3).
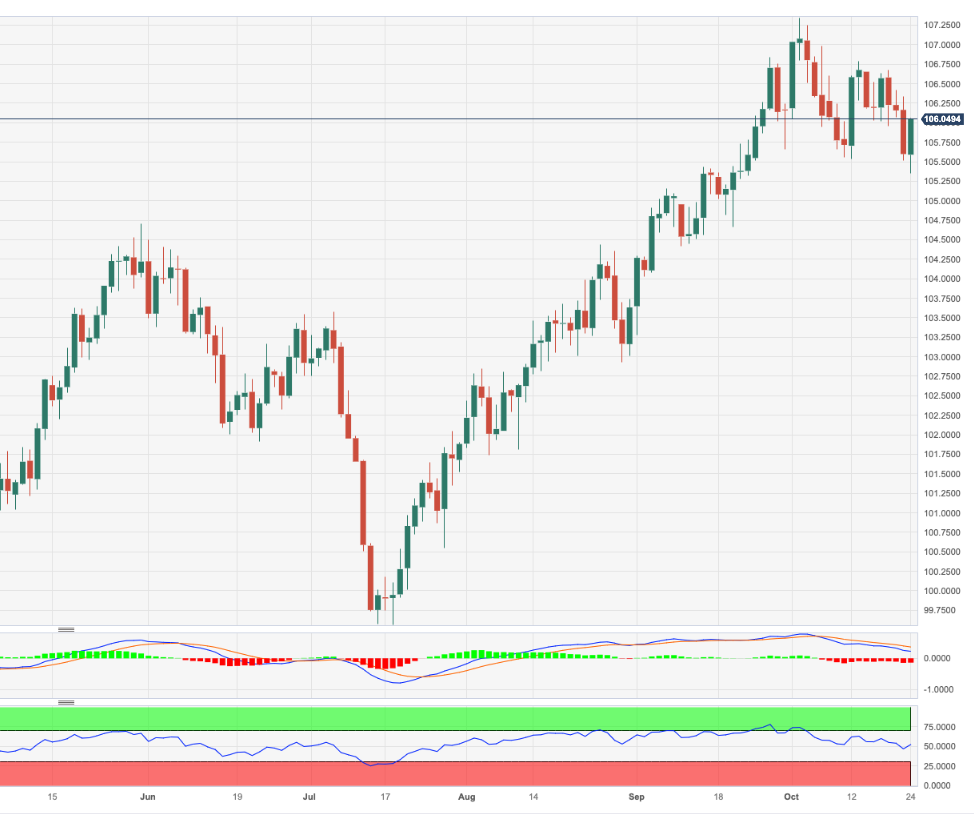
For now, as long as it remains above the key 200-day SMA, today at 103.32, the outlook for the index is expected to remain constructive.
DXY Daily Chart
Source: Fx Street
I am Joshua Winder, a senior-level journalist and editor at World Stock Market. I specialize in covering news related to the stock market and economic trends. With more than 8 years of experience in this field, I have become an expert in financial reporting.


