
- The DXY is under pressure and returns to the 105.00 area.
- A further rise could see the recent years high near 105.60 revised.
The DXY moderated in its recent strong rise to some extent and retreats to the 105.00 area at the end of the week.
The continuation of the multi-week rally is now expected to shift attention towards the 2023 high of 105.88 (March 8) before the round level of 106.00.
As long as it remains above the key 200-day SMA, today at 103.03, the outlook for the index is expected to remain constructive.
DXY daily chart
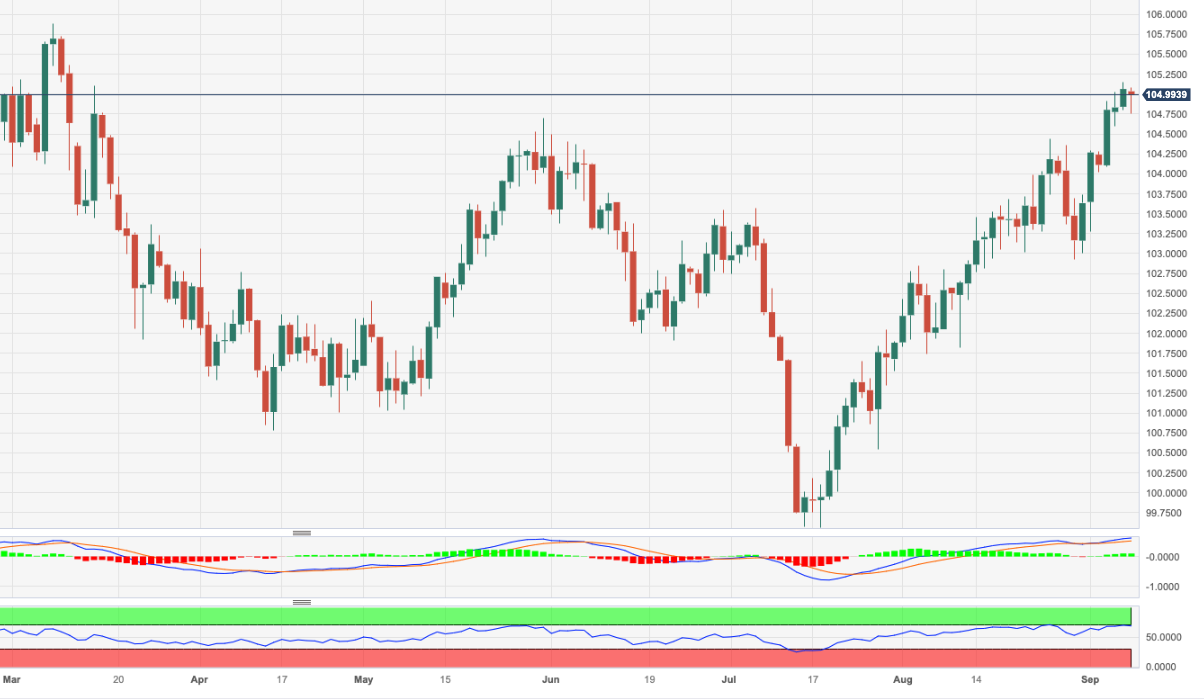
Source: Fx Street
I am Joshua Winder, a senior-level journalist and editor at World Stock Market. I specialize in covering news related to the stock market and economic trends. With more than 8 years of experience in this field, I have become an expert in financial reporting.


