
- DXY adds to Wednesday’s gains and retraces 113.00.
- Further up is the October high around the 114.00 area.
The US Dollar Index (DXY) continues to advance in response to FOMC induced tailwinds and reclaims the 113.00 barrier and above on Thursday.
The recovery of the dollar seems ready to continue in the short term, always with the immediate objective of the highs of October in the area of 114.00 (October 21). Once surpassed, the index could challenge the 2022 high near 114.80 recorded on September 28.
The current bullish stance is seen unchanged as long as the 9-month support line near 108.80 holds the downside. The latter seems reinforced by the proximity of the 100-day SMA.
Longer term, DXY is expected to maintain its constructive stance as long as it is above the 200-day SMA at 104.38.
DXY daily chart
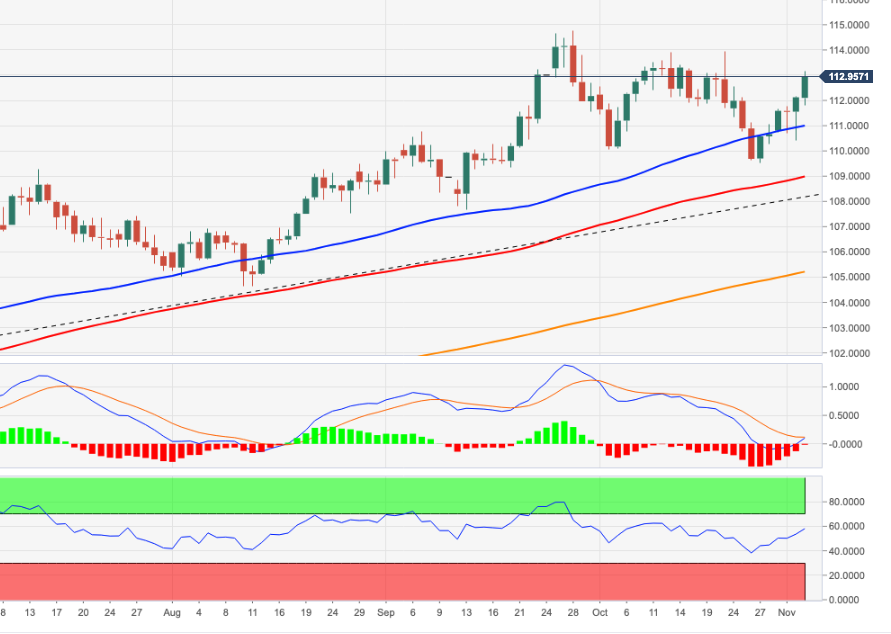
Source: Fx Street
With 6 years of experience, I bring to the table captivating and informative writing in the world news category. My expertise covers a range of industries, including tourism, technology, forex and stocks. From brief social media posts to in-depth articles, I am dedicated to creating compelling content for various platforms.


