
- The US Dollar Index (DXY) extended the decline for the third straight session on Monday.
- Minor support lines up at the weekly low of 102.58.
The US dollar index (DXY) it pulls back for the third session in a row and trades at fresh monthly lows in the 103.40/35 zone on Monday.
A continuation of the pullback looks likely at least in the short term. Against this, there is little support at the weekly low of 102.58 (Feb 14), while a loss of this zone could trigger a deeper pullback to the yoy low near 101.80 (Feb 2).
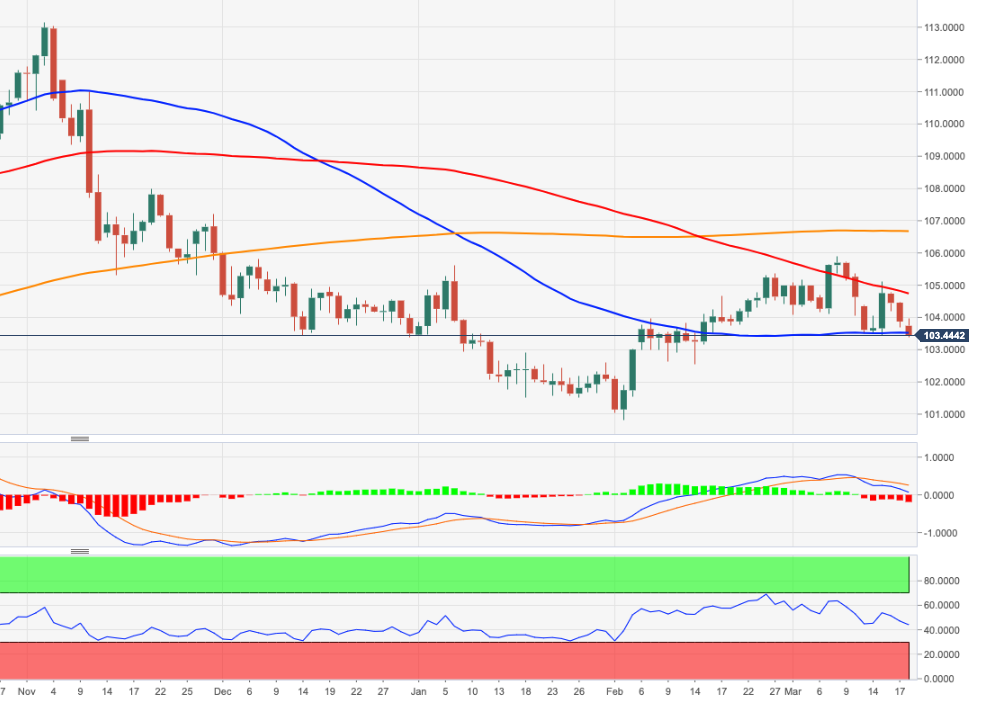
Overall, as long as it stays below the 200-day SMA (106.63), the outlook for the greenback will remain negative.
DXY daily chart
Source: Fx Street
I am Joshua Winder, a senior-level journalist and editor at World Stock Market. I specialize in covering news related to the stock market and economic trends. With more than 8 years of experience in this field, I have become an expert in financial reporting.


