
- The DXY is cruising within a tight range still below 106.00.
- Further bullish momentum should test the 106.00 barrier.
He US Dollar Index (DXY) It seems to continue to extend last week’s bounce, although the 106.00 area turns out to be a fairly strong barrier for the moment.
Once above the 106.00 barrier, the US Dollar Index could embark on a possible test of the November high at 107.11 (November 1) before the 2023 high at 107.34 (October 3).
Meanwhile, as long as it holds above the 200-day SMA, today at 103.60, the outlook for the DXY is expected to remain constructive.
DXY Daily Chart
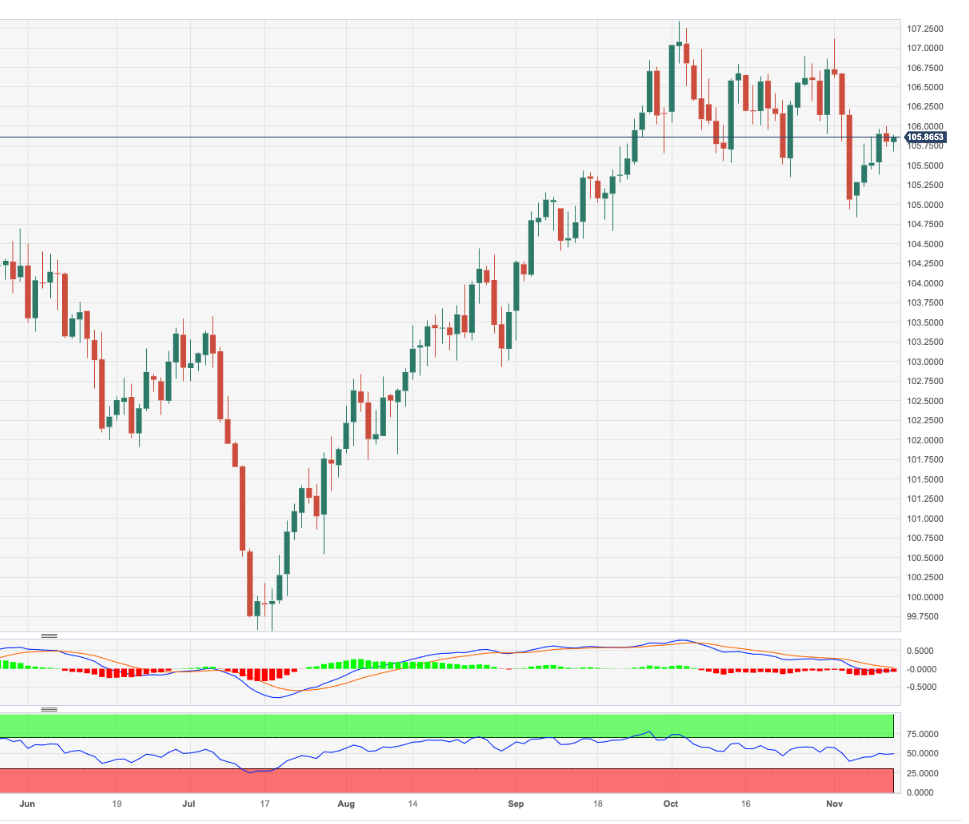
Source: Fx Street
I am Joshua Winder, a senior-level journalist and editor at World Stock Market. I specialize in covering news related to the stock market and economic trends. With more than 8 years of experience in this field, I have become an expert in financial reporting.


