
- DXY breaks below 105.00 again on Wednesday.
- A deeper pullback could lead to revisiting the weekly low near 104.40.
He DXY resumes the decline and retests the 105.00 zone on Wednesday.
Should the corrective pullback accelerate, the US Dollar Index could extend the decline to, initially, the weekly low of 104.42 (September 11). A sustained pullback below this latest level could see the index embark on a possible test of the critical 200-day SMA, today at 103.03.
As long as it remains above the 200-day SMA, the outlook for the DXY will remain constructive.
DXY Daily Chart
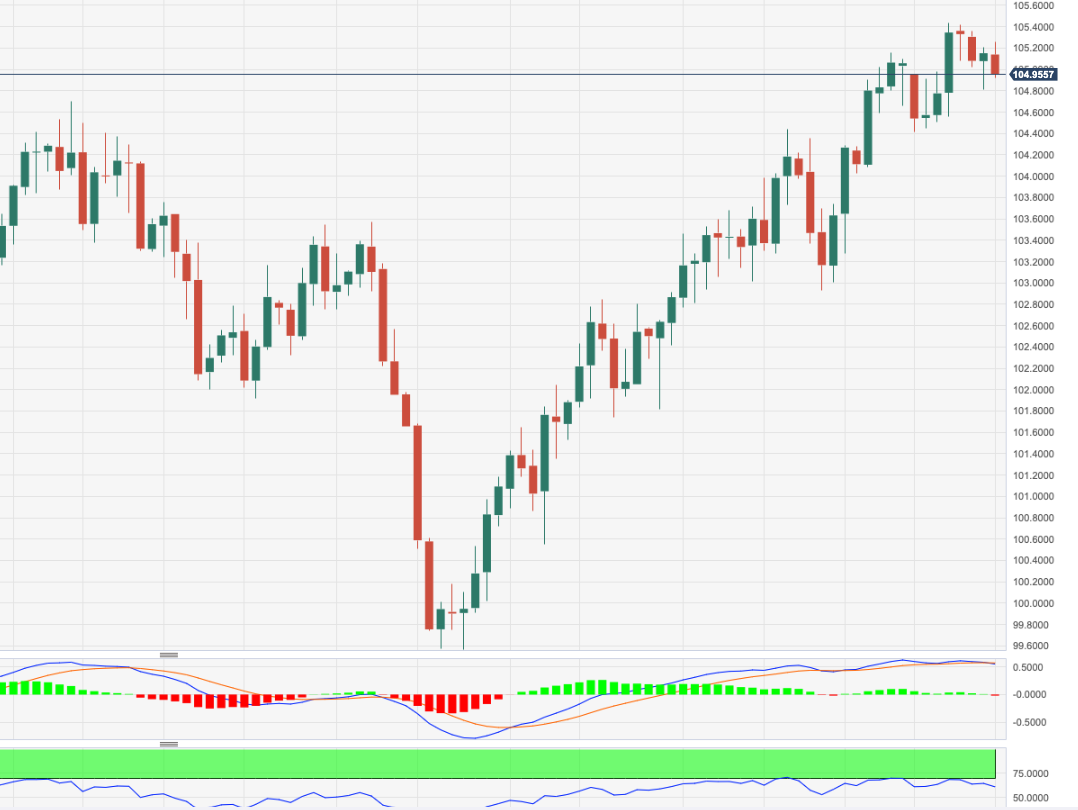
Source: Fx Street
I am Joshua Winder, a senior-level journalist and editor at World Stock Market. I specialize in covering news related to the stock market and economic trends. With more than 8 years of experience in this field, I have become an expert in financial reporting.


