
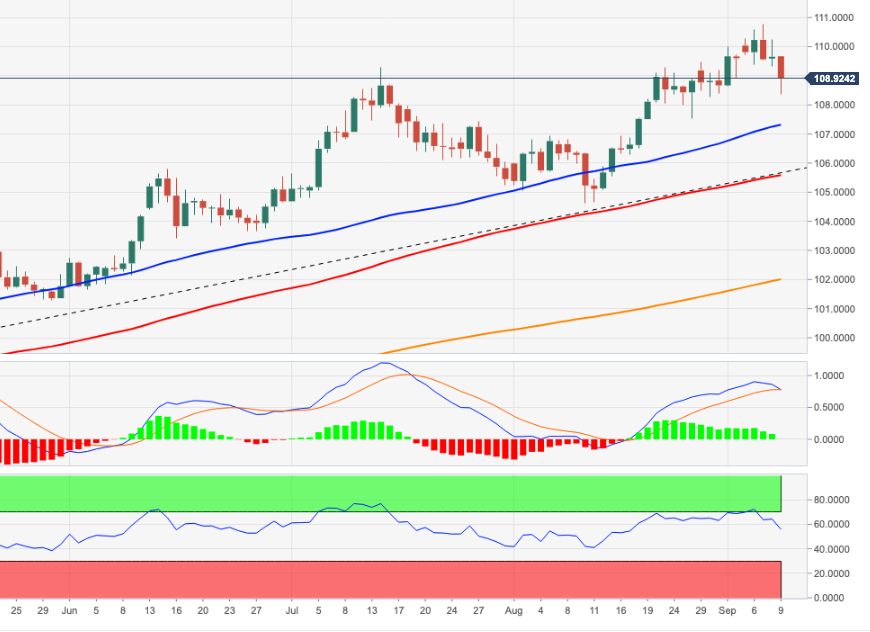
- The US Dollar Index (DXY) adds to the weekly decline and revisits the 108.40/35 band.
- A deeper drop to the 107.60 area cannot be ruled out.
The US Dollar Index (DXY) Intensifies weekly pullback and breaks below key support at 109.00 with some conviction on Friday.
Despite the corrective decline, the underlying bullish view on the dollar remains. That said, the index could allow for a deeper drop to initially the weekly low at 107.58 (Aug 26). The proximity of the temporary 55-day SMA, today at 107.17, also reinforces this support zone.
Meanwhile, the constructive short-term outlook continues to be bolstered by the 7-month support line just below 106.00.
As for the long-term scenario, the bullish outlook on the dollar remains in place as long as it is above the 200-day SMA at 101.33.
DXY daily chart
Technical levels
Source: Fx Street
With 6 years of experience, I bring to the table captivating and informative writing in the world news category. My expertise covers a range of industries, including tourism, technology, forex and stocks. From brief social media posts to in-depth articles, I am dedicated to creating compelling content for various platforms.


