
- The US Dollar Index (DXY) is trading with no clear direction around 106.40.
- Occasional bullish attempts are targeting the weekly high near 107.40.
The US Dollar Index (DXY) attempts a consolidation move at the 106.50 area on Thursday amid a cautious tone ahead of the July Non-Farm Payrolls release on Friday.
Meanwhile, the index’s occasional gains should find initial resistance at the post-FOMC high at 107.42 (July 27), which is seen as the last defense for an assault on the 2022 high at 109.29 (July 14).
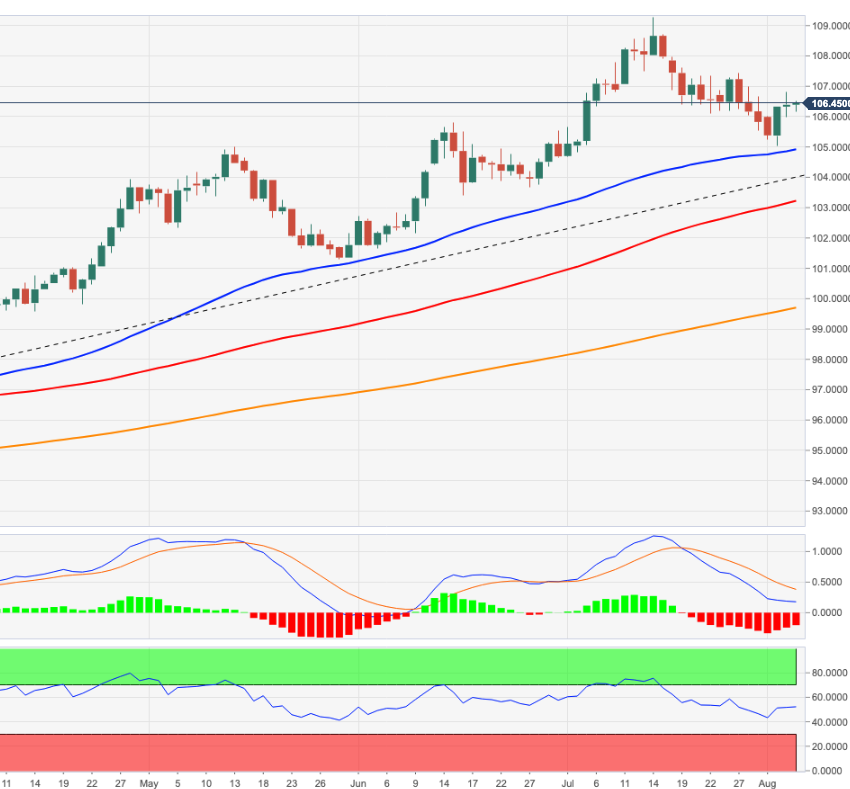
The short-term upside is expected to continue as long as it is above the 6-month support line today at 104.15.
Also, the broader bullish view on the dollar remains in place as long as it is above the 200-day SMA at 99.68.
DXY daily chart
Technical levels
Source: Fx Street
With 6 years of experience, I bring to the table captivating and informative writing in the world news category. My expertise covers a range of industries, including tourism, technology, forex and stocks. From brief social media posts to in-depth articles, I am dedicated to creating compelling content for various platforms.


