
- DXY is trading at cycle highs above 107.00.
- Further gains look likely and are targeting the 107.30 area.
The US Dollar Index (DXY) adds to the ongoing strong rally and leaves behind the 107.00 level on Wednesday, or new all-time highs.
On the short-term horizon, the dollar continues to rise. In this sense, the index could revisit the December 2002 high at 107.31, before the October 2002 high at 108.74.
As long as the 4-month line near 102.60 contains the downside, the short-term outlook for the index should remain constructive.
The broader bullish view holds as long as it is above the 200-day SMA at 32.
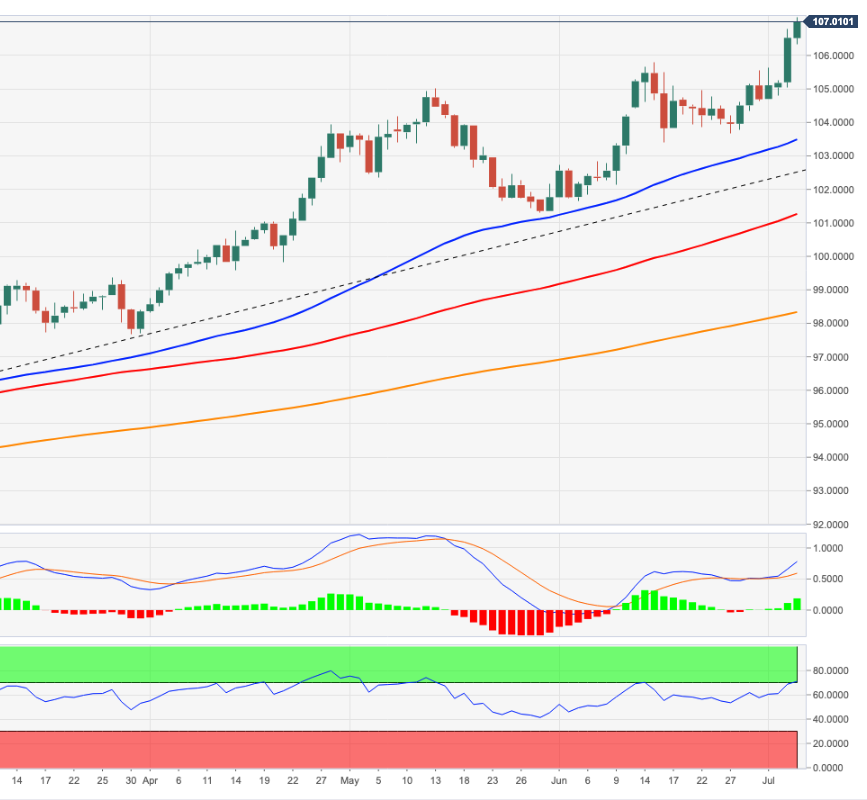
However, keep in mind that the index is trading in overbought territory and therefore could attempt a technical correction in the not too distant future.
DXY daily chart
Technical levels
Source: Fx Street
With 6 years of experience, I bring to the table captivating and informative writing in the world news category. My expertise covers a range of industries, including tourism, technology, forex and stocks. From brief social media posts to in-depth articles, I am dedicated to creating compelling content for various platforms.


")
