
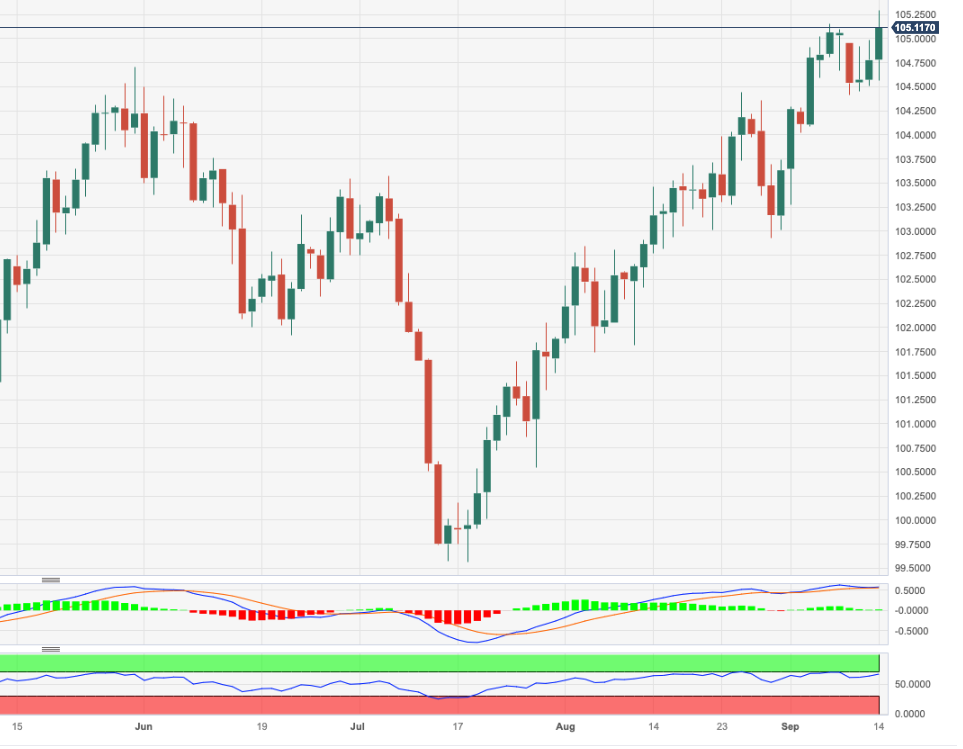
- DXY hits new highs near 105.30 on Thursday.
- The continuation of the bullish bias now points to the 2023 high.
He DXY It adds to Wednesday’s advance and reaches new six-month highs above 105.00 on Thursday.
The continuation of the multi-week rally looks strong and a break of the monthly high of 105.28 (September 14) should encourage DXY to retest the 2023 high of 105.88 (March 8), just before the round 106.00 level .
As long as it remains above the key 200-day SMA, today at 103.02, the outlook for the DXY is expected to remain constructive.
DXY Daily Chart
Source: Fx Street
I am Joshua Winder, a senior-level journalist and editor at World Stock Market. I specialize in covering news related to the stock market and economic trends. With more than 8 years of experience in this field, I have become an expert in financial reporting.


