
- Long-term technical analysis of the US Dollar Index suggests a sideways trend.
- It is likely to continue until a decisive break above or below the range occurs.
- The index is finding resistance at the 100-week simple moving average.
The US Dollar Index (DXY), which measures the strength of the US Dollar (USD) against a basket of trade-weighted competitors, is in a long-term sideways trend that has lasted between six months and a year.
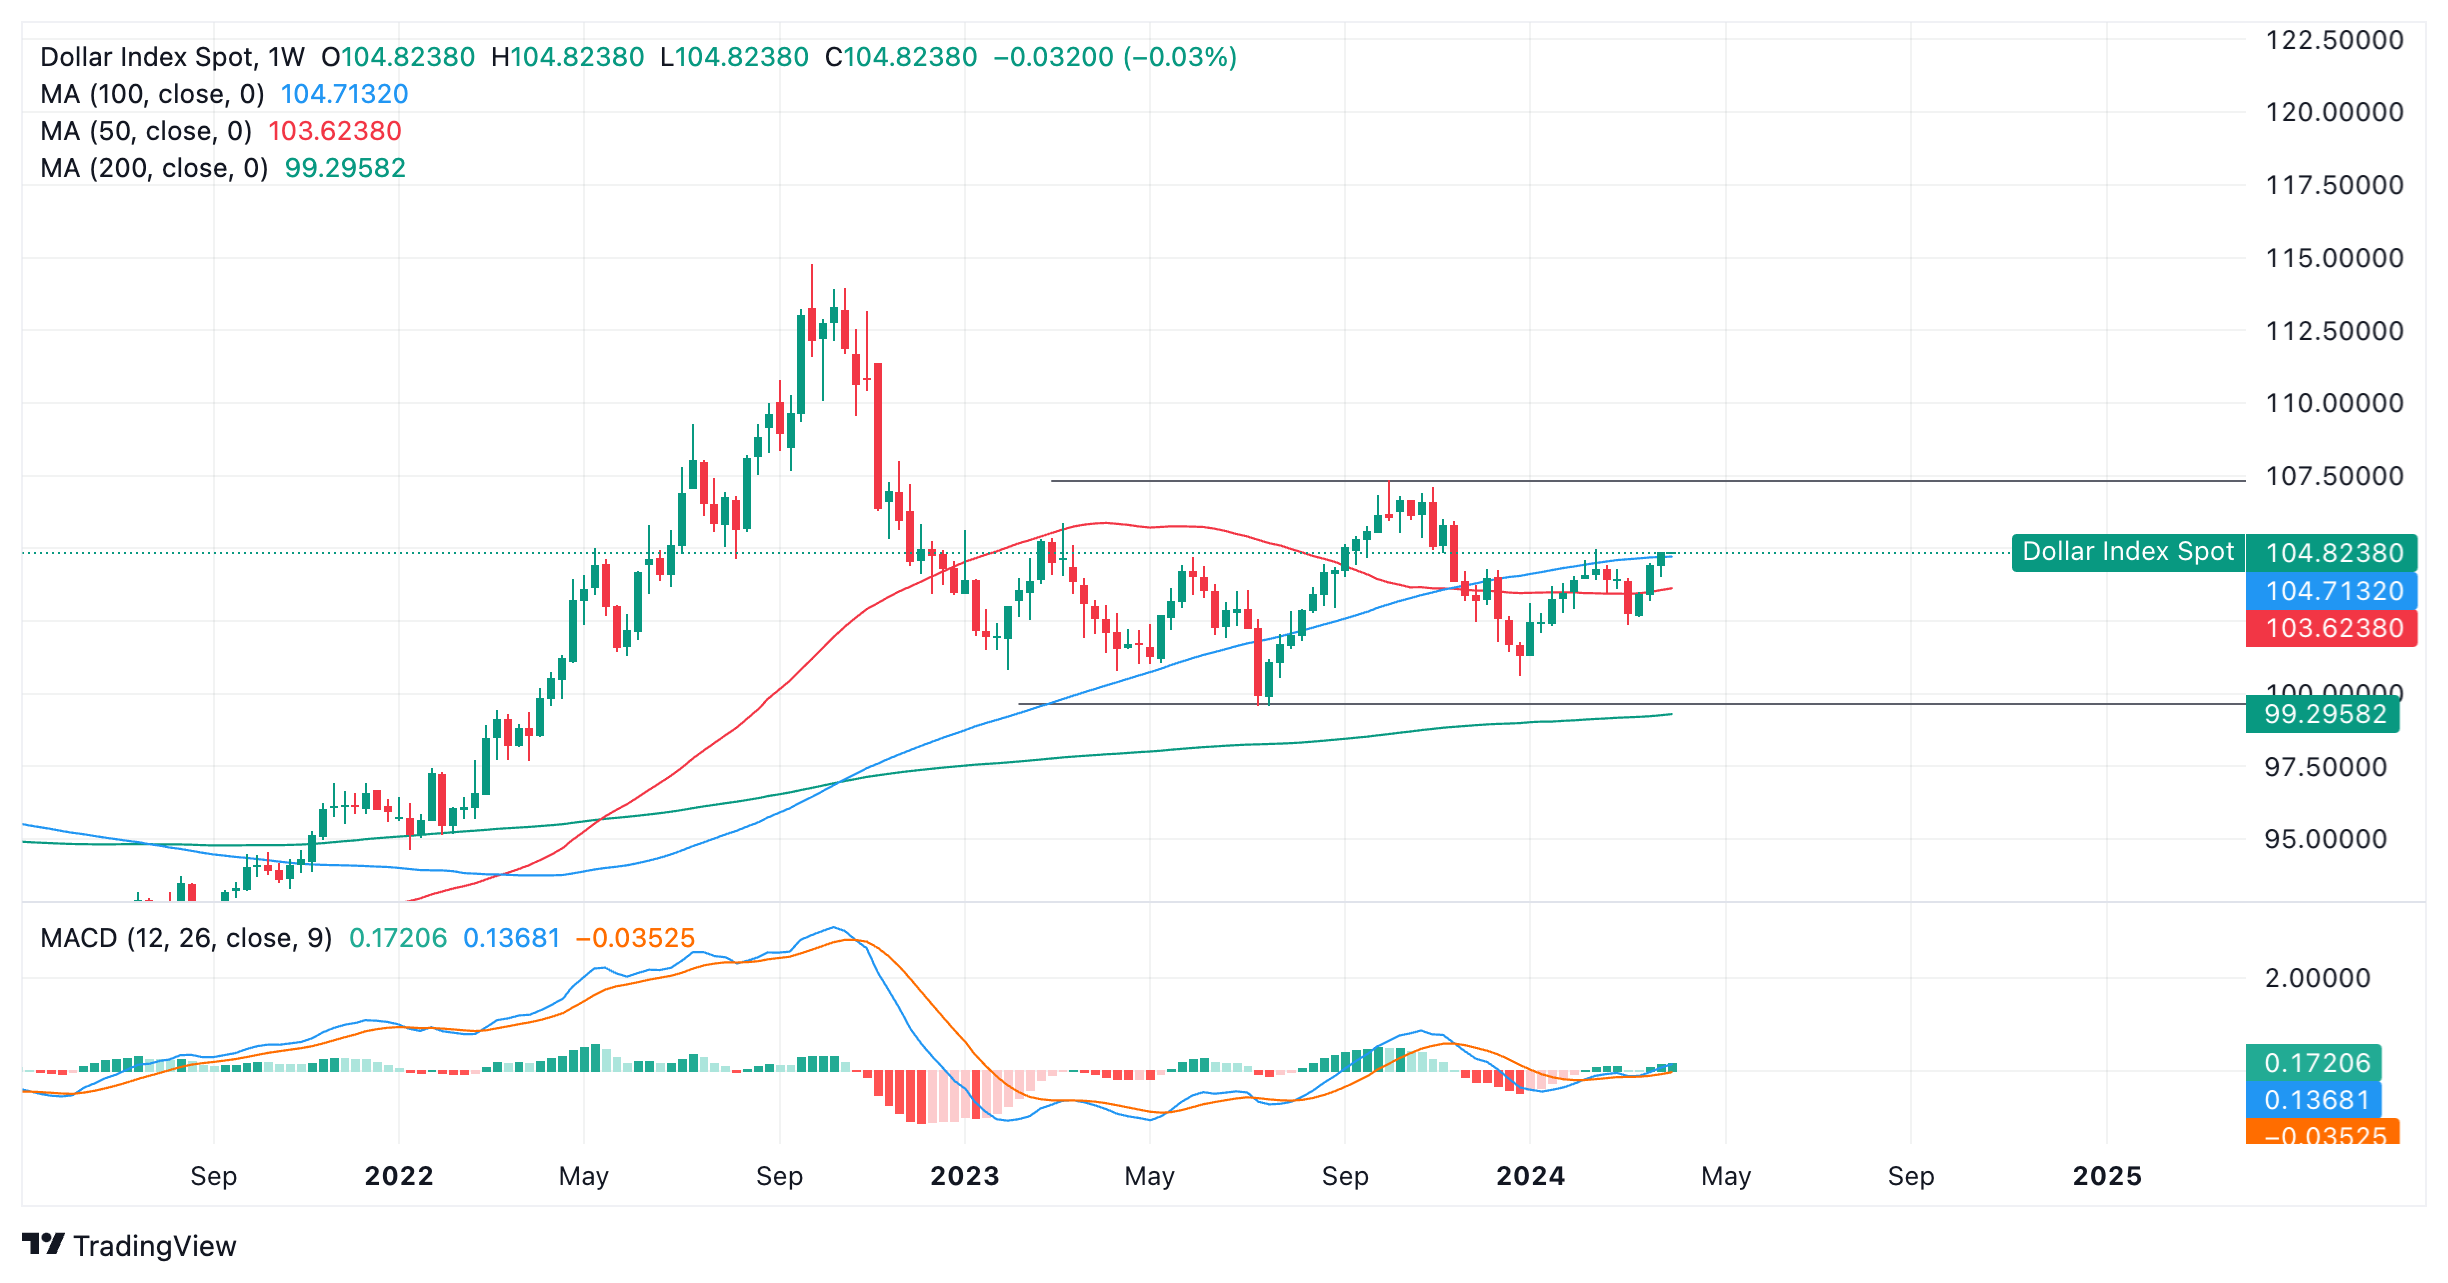
US Dollar Index: Weekly Chart
Within its consolidation range, it is currently encountering resistance after rising to the 100-week SMA at 104.71 points.
There is a possibility that it will retreat from this important barrier. The 50-week simple moving average is near 103.62 and could provide support.
Before the range formation, the outlook for the Dollar Index was more bearish. The DXY sharply retraced the September 2022 highs and plunged. However, the DXY found support first at 100.00 and then at 99.00 before reversing the trend and recovering.
Since the index found a bottom in 2023, it has been oscillating between the aforementioned lows and a high around 107.00. A decisive break below 99.00 would be needed for the index to recover.
A decisive break below 99.56 – the July 2023 lows – would be needed to indicate that the bears are back on track. This move would change the trend to bearish and suggest even lower lows on the horizon.
Alternatively, a decisive break above 107.00 would give a more bullish tone to the chart and suggest a rally back to the 2022 high of 114.78.
“Decisive” would mean a weekly candle that broke and closed well away from the range's high or low, or three consecutive bearish/bullish weeks that ended well away from the range's high or low.
Until either materializes, the price is considered to continue its sideways trend pattern.
Source: Fx Street
I am Joshua Winder, a senior-level journalist and editor at World Stock Market. I specialize in covering news related to the stock market and economic trends. With more than 8 years of experience in this field, I have become an expert in financial reporting.


