
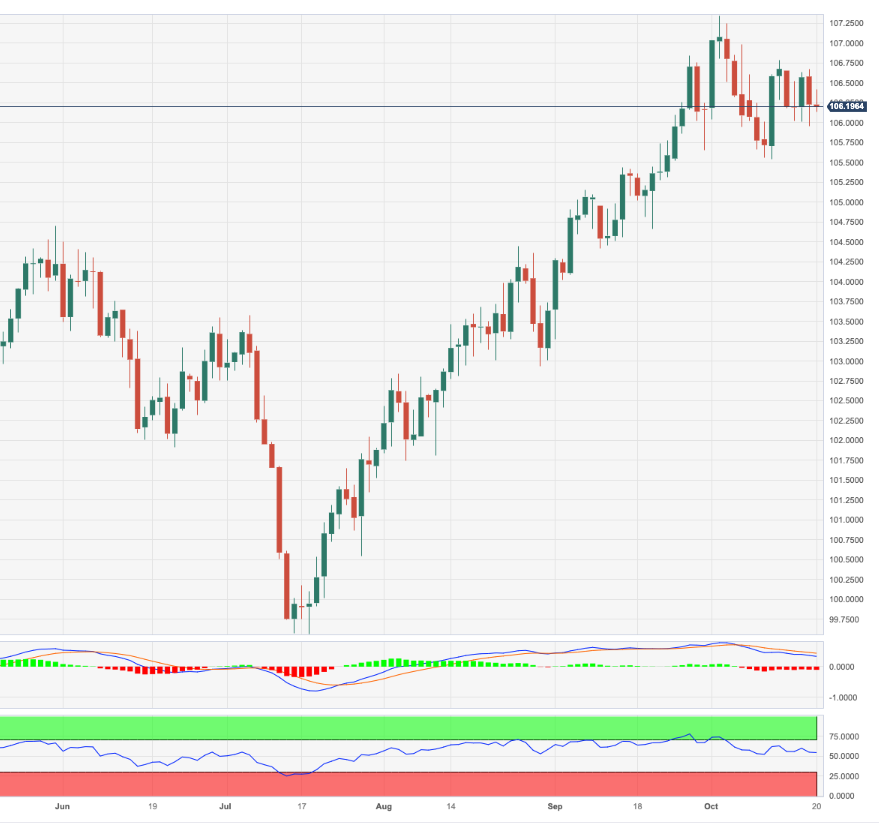
- The DXY alternates gains with losses in the low area of 106.50.
- In the short term it appears that further consolidation will occur.
He DXY trades inconclusively around the 106.20-106.30 zone at the end of the week.
It seems that the DXY has entered a consolidation phase for the moment. Meanwhile, occasional bullish attempts continue to target the weekly high of 106.78 (Oct 12) ahead of the 2023 high of 107.34 (Oct 3). To the downside, the monthly low of 105.53 (October 12) is expected to contain the declines.
For now, as long as it remains above the key 200-day SMA, today at 103.29, the outlook for the DXY is expected to remain constructive.
DXY Daily Chart
Source: Fx Street
I am Joshua Winder, a senior-level journalist and editor at World Stock Market. I specialize in covering news related to the stock market and economic trends. With more than 8 years of experience in this field, I have become an expert in financial reporting.


