
- DXY extends the upside and rises to 3-day highs near 109.20.
- Additional gains remain above the 105.60 region.
The US Dollar Index (DXY) reverses Wednesday’s decline and resumes buying interest above 109.00 on Thursday.
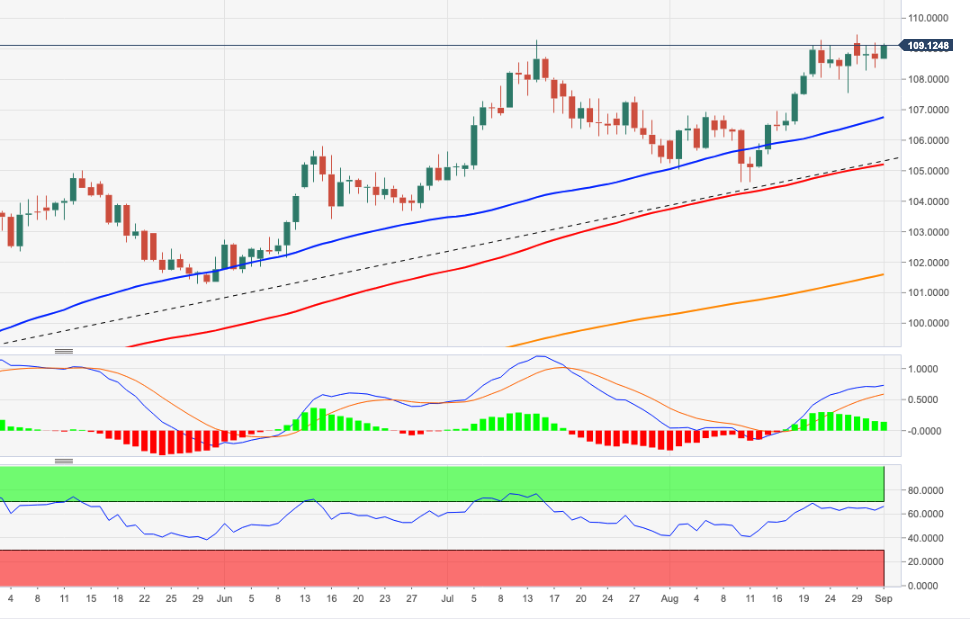
Prospects for a further bounce look solid as long as it is above the 7-month support line today around 105.60. On the contrary, the breakout of the 2022 high at 109.47 (Aug 29) should pave the way to challenge the September 2002 high at 109.77 and the round level at 110.00.
As for the long-term scenario, the bullish view of the dollar remains as long as it is above the 200-day SMA at 100.93.
DXY daily chart
Technical levels
Source: Fx Street
With 6 years of experience, I bring to the table captivating and informative writing in the world news category. My expertise covers a range of industries, including tourism, technology, forex and stocks. From brief social media posts to in-depth articles, I am dedicated to creating compelling content for various platforms.


