
- The US Dollar Index (DXY) remains offered and tests the area below 108.00.
- If the index accelerates its losses, it could retest the 107.60/55 zone.
The US Dollar Index (DXY) starts the week on the negative foot and briefly drops to multi-week lows in the area below 108.00.
Despite the weakness surrounding the dollar, his short-term bullish view remains as long as it trades above the 7-month support line around 106.10.
If sellers push further, then a possible test of the weekly low at 107.58 (Aug 26), just before the intermediate 55-day SMA at 107.25, could start to appear on the horizon.
Looking at the long-term scenario, the constructive view on DXY remains unchanged as long as it is above the 200-day SMA at 101.39.
DXY daily chart
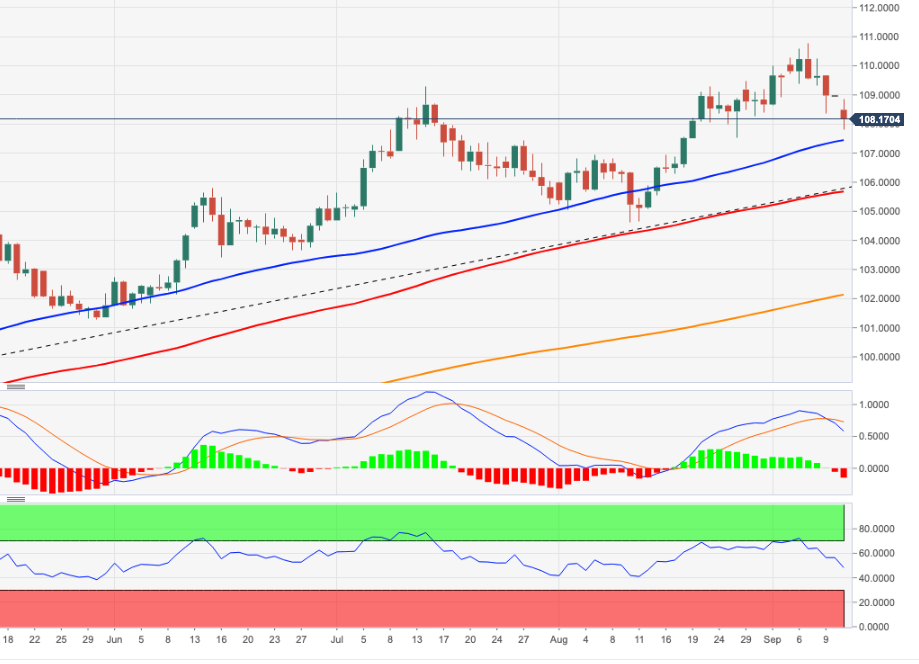
Technical levels
Source: Fx Street
With 6 years of experience, I bring to the table captivating and informative writing in the world news category. My expertise covers a range of industries, including tourism, technology, forex and stocks. From brief social media posts to in-depth articles, I am dedicated to creating compelling content for various platforms.


