
- DXY corrects lower and falls to multi-session lows.
- The dollar could have charted a short-term top near 110.80.
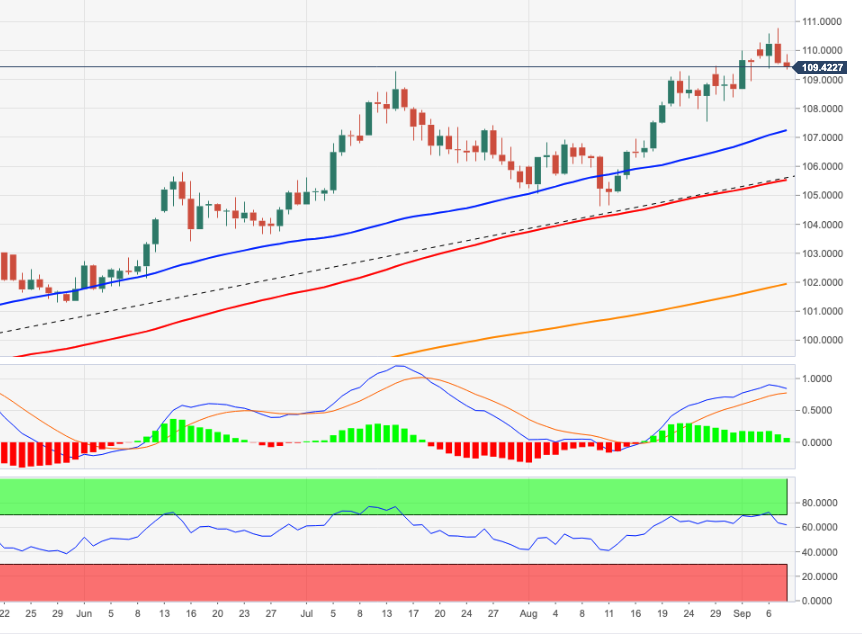
The US Dollar Index (DXY) is trading on the defensive for the second session in a row and extends the recent break below 110.00.
However, the short-term bullish view on the dollar remains good for now and is reinforced by the 7-month support line just below 106.00 so far.
A further retracement on the short-term horizon could leave the recent 20-year high near 110.80 (Sep 7) as an interim peak. Breaking out of this area could open the door to weekly highs of 111.90 (June 6, 2002) and 113.35 (May 24, 2002).
Looking at the long-term scenario, the bullish view on the dollar holds as long as it is above the 200-day SMA at 101.26.
DXY daily chart
Technical levels
Source: Fx Street
With 6 years of experience, I bring to the table captivating and informative writing in the world news category. My expertise covers a range of industries, including tourism, technology, forex and stocks. From brief social media posts to in-depth articles, I am dedicated to creating compelling content for various platforms.


