
- The US Dollar Index (DXY) continues to push higher and hits highs near 110.80.
- Further rallies could see 111.00 revisited.
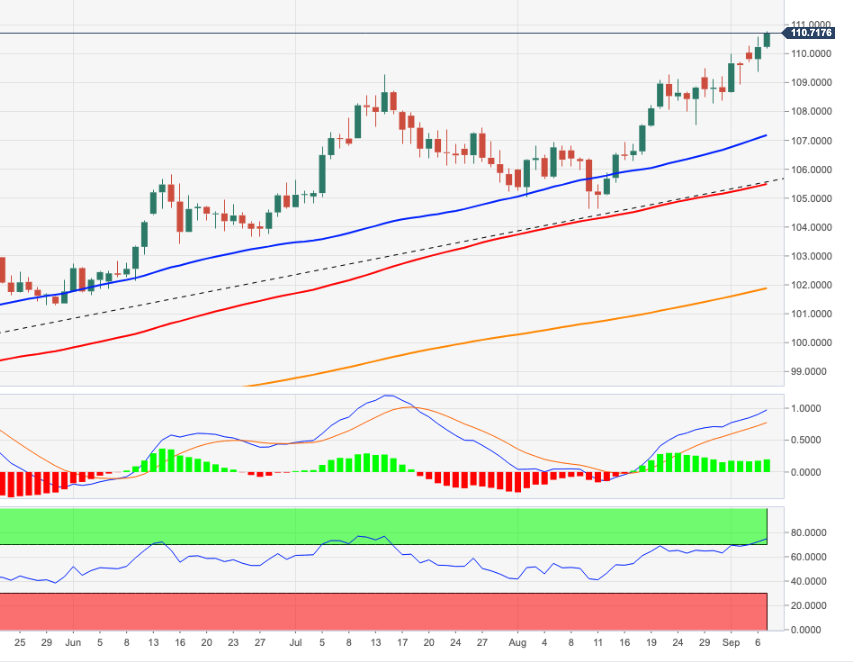
The US Dollar Index (DXY) advances for the third consecutive session and approaches 111.00 on Wednesday.
The short-term bullish view on the dollar holds for now and is underpinned by the 7-month support line just below 106.00.
Still on the upside, the breakout of the recent high at 110.78 (Sep 7) could face the next barrier at the weekly highs of 111.90 (June 6, 2002) and 113.35 (May 24, 2002).
As for the long-term scenario, the bullish view of the dollar remains as long as it is above the 200-day SMA at 101.20.
DXY daily chart
Technical levels
Source: Fx Street
With 6 years of experience, I bring to the table captivating and informative writing in the world news category. My expertise covers a range of industries, including tourism, technology, forex and stocks. From brief social media posts to in-depth articles, I am dedicated to creating compelling content for various platforms.


