
- DXY appears to have found some pretty decent support around 108.00.
- A visit to the 2002 highs should not be ruled out in the short term.
- The US Dollar Index (DXY) loses momentum and revisits weekly lows around 108.00 on Thursday.
Despite the corrective move, it looks like the index may still go higher. That said, bouts of weakness could be seen as buying opportunities ahead of a likely retest of 109.00 and a possible revisit of the 2022 high at 109.29 (14 Jul). Above the latter is the September 2002 high at 109.77 before the round level of 110.00.
Meanwhile, as long as it is above the 6-month support line around 105.20, the index is expected to maintain the positive stance in the short term.
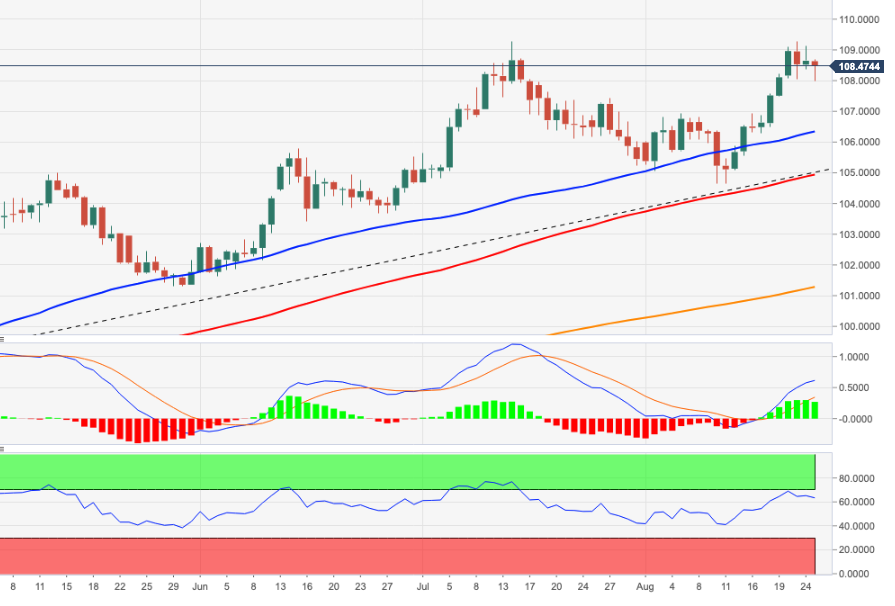
As for the long-term scenario, the bullish view of the dollar remains as long as it is above the 200-day SMA at 100.61.
DXY daily chart
Technical levels
Source: Fx Street
With 6 years of experience, I bring to the table captivating and informative writing in the world news category. My expertise covers a range of industries, including tourism, technology, forex and stocks. From brief social media posts to in-depth articles, I am dedicated to creating compelling content for various platforms.


