
- The Dollar Index has touched a key support level at the 100 mark.
- Historically, this has provided a platform for a recovery, however, it is too early to say whether history will repeat itself.
The Dollar Index (DXY) is in a medium to long-term sideways trend within a multi-year range. Since late July, it has been developing a bearish extension within that range from the ceiling around 105, to the floor of the range at the 100 level.
100 is important. In addition to being a key psychological level, 100 is also an important historical support level that has provided a safety net to falling prices on three previous occasions since 2023 (circled below). The question is, will 100 come to the rescue again this time?
Dollar Index Daily Chart
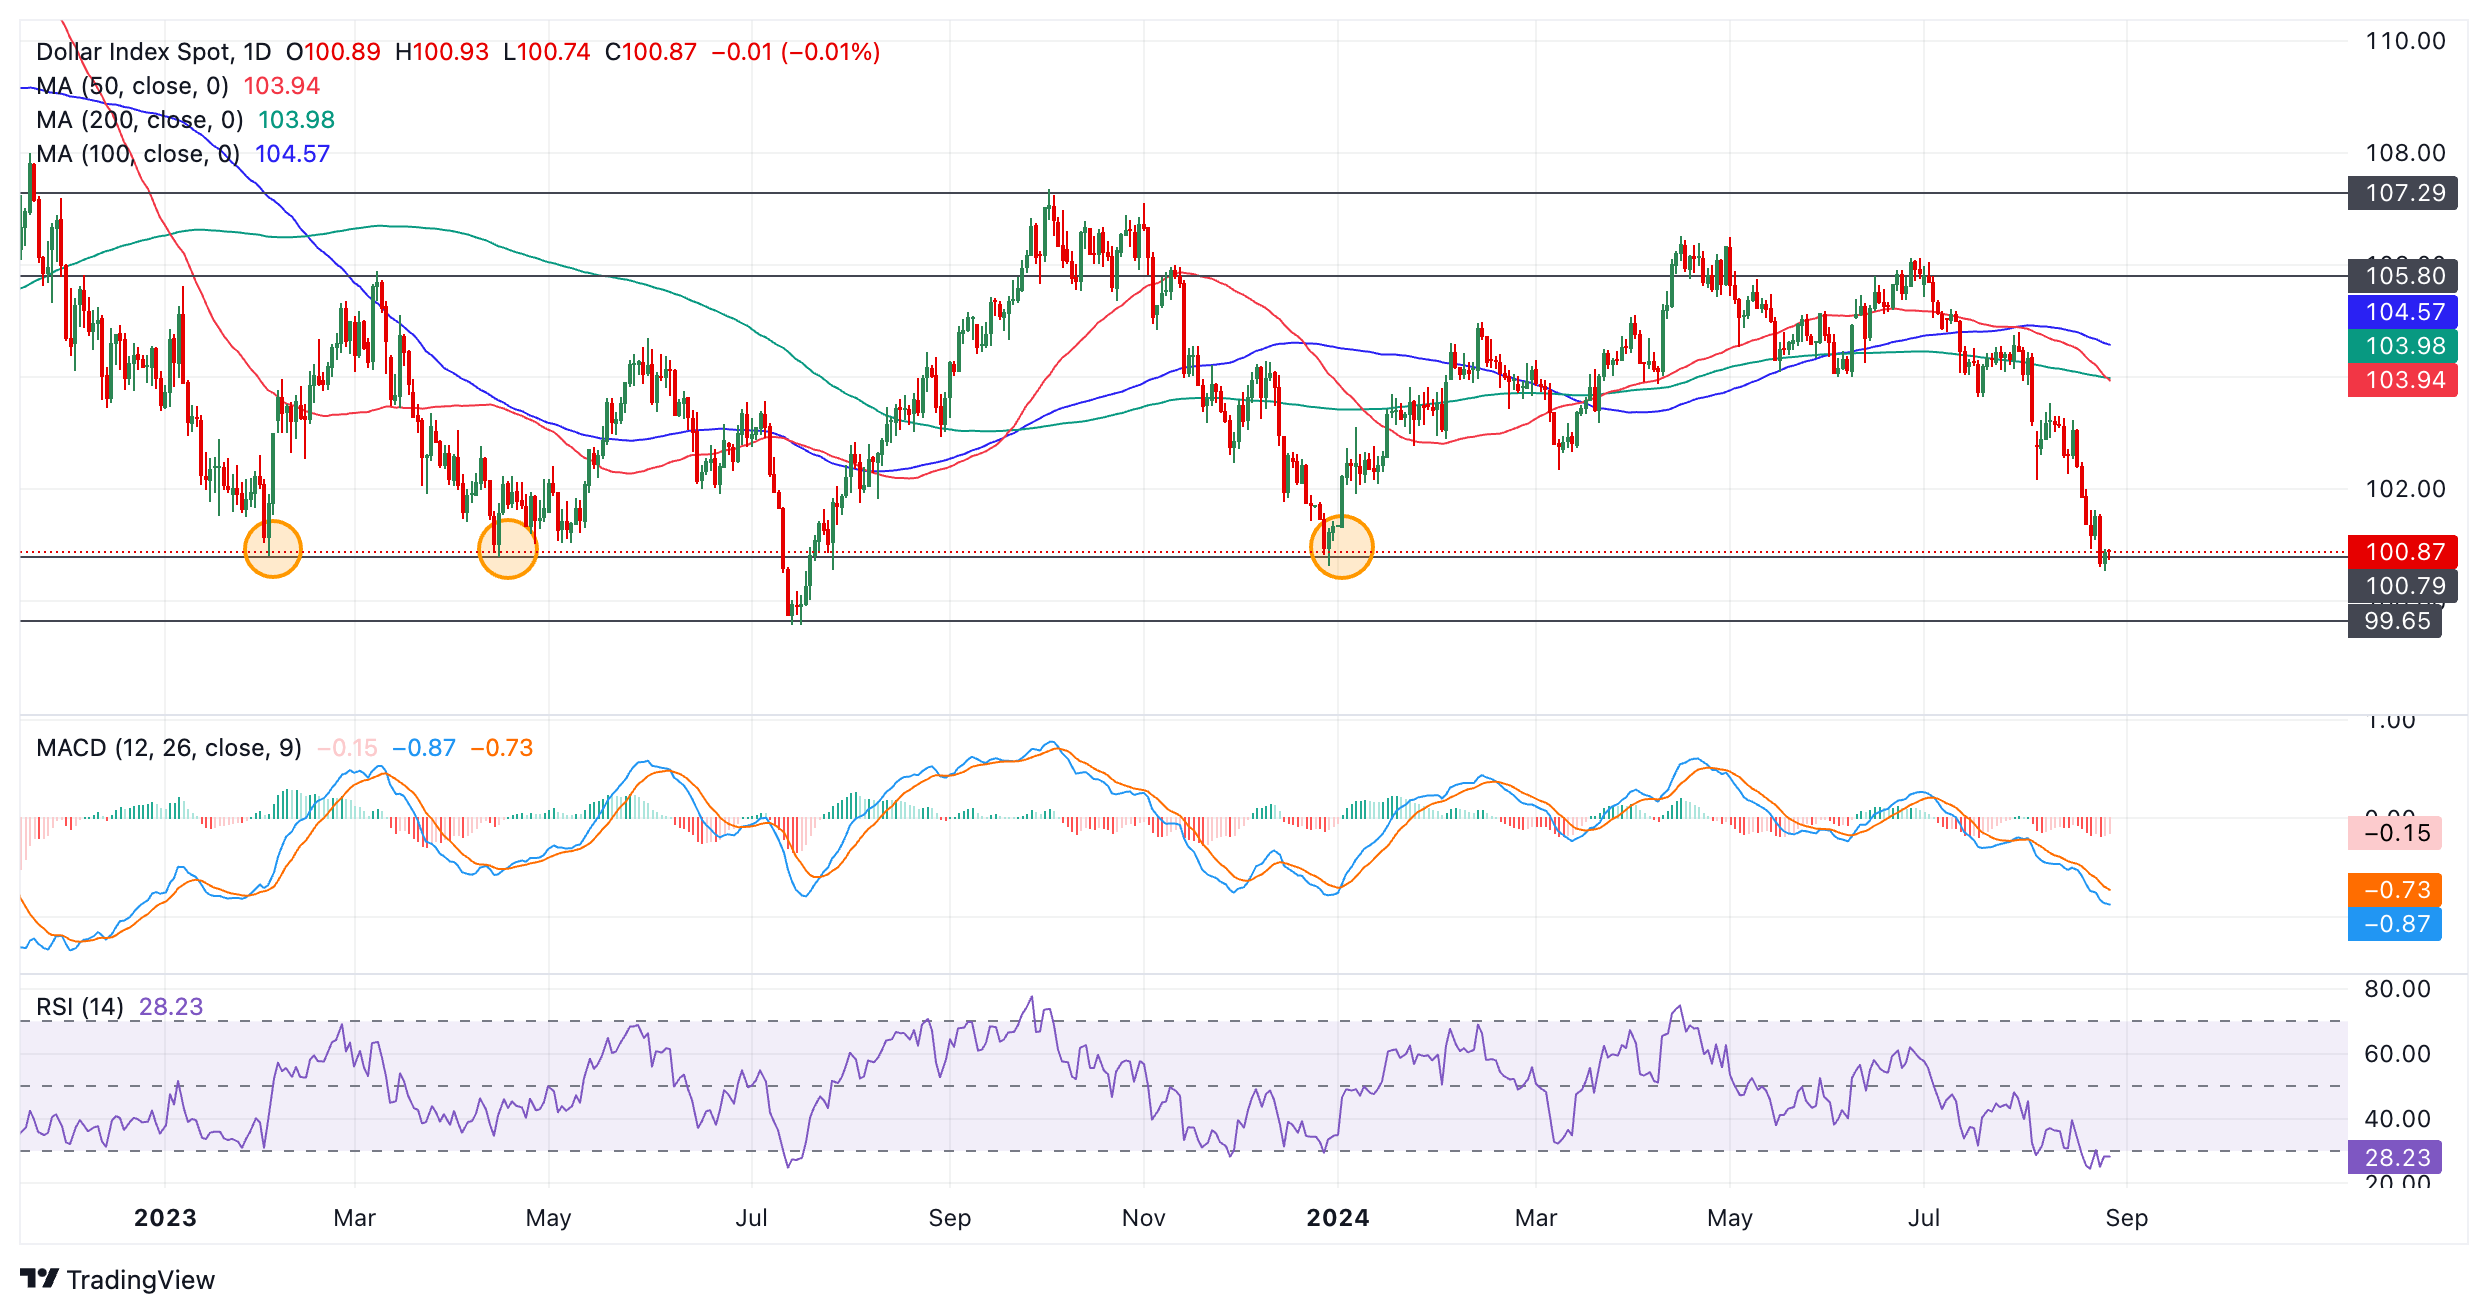
Price action remains bearish and no strong bullish reversal patterns are forming, either in the form of a candlestick or a form of a Japanese candlestick. This suggests a risk of further declines. A continuation south would likely see the DXY reach the next support level at 99.57, the July 2023 low. This is the lower bottom of the range – a decisive break below there would be a very bearish signal.
The Relative Strength Index (RSI) momentum indicator is oversold on both the daily and weekly charts (not shown). This suggests that prices are overextended to the downside and there is an increased risk of a pullback occurring.
However, the RSI has not yet broken out of the oversold zone, a necessary prerequisite for a buy signal. As things stand, the fact that the RSI is oversold is simply a warning to bears not to add to their short positions – it would have to break out of oversold completely to provide a reversal signal.
The Moving Average Convergence/Divergence (MACD) momentum oscillator has also failed to cross above its red signal line. This would also be needed to provide a buy signal.
To conclude, there is a risk that even though the Dollar Index has hit an all-time low, it could simply continue to fall unless price action forms a reversal pattern or momentum indicators provide strong buy signals.
Source: Fx Street
I am Joshua Winder, a senior-level journalist and editor at World Stock Market. I specialize in covering news related to the stock market and economic trends. With more than 8 years of experience in this field, I have become an expert in financial reporting.


