
- A pause in dollar selling offers a respite to USD/CAD.
- Oil price weakness helps alleviate downward pressure on the pair.
- The 50-day SMA defies bullish commitment as the focus is on Canadian inflation.
The USD/CAD licks its wounds as it defends the 1.2850 regionhitting a two-week low as US dollar bears take a breather after recent downward spiral.
The sentiment remains optimistic amid easing fears of a recession, as Russia’s Nord Stream 1 reopens at reduced levels and expectations of a 100 basis point Fed interest rate hike fade in July. On the other hand, Netflix Inc. reported lower-than-expected subscriber loss, also improving market sentiment.
On the other hand, a further pullback in WTI prices also helps cushion the decline in the USD/CAD pair. Black gold fell during the Asian session after API crude stockpiles rose by 1.86 million barrels vs. 1.40 million forecast.
Looking ahead, US dollar price action and Canadian inflation data will become the main drivers for the pair. The Canadian Consumer Price Index (CPI) is forecast to be 8.4% YoY in June, down from 7.7% in the previous month. Annualized Core CPI is likely to rise 6.7% in June, versus 6.1% previously reported. Note that the Bank of Canada (BoC) unexpectedly raised official interest rates by 100 basis points to 2.5% at its monetary policy meeting last week to fight runaway inflation.
From a short-term technical perspective, USD/CAD is challenging the critical 50-day moving average at 1.28558at the time of writing.
A daily close below the latter is needed to resume bearish momentum from the 1.3200 levels. The 14-day RSI has flattened out but remains below the 50 level, which suggests that the bearish bias seems well established in the short term.
A break of key support could trigger a sharp decline towards the slightly bullish 100 SMA at 1.2771. Before that, the round level of 1.2800 could be tested.
USD/CAD daily chart
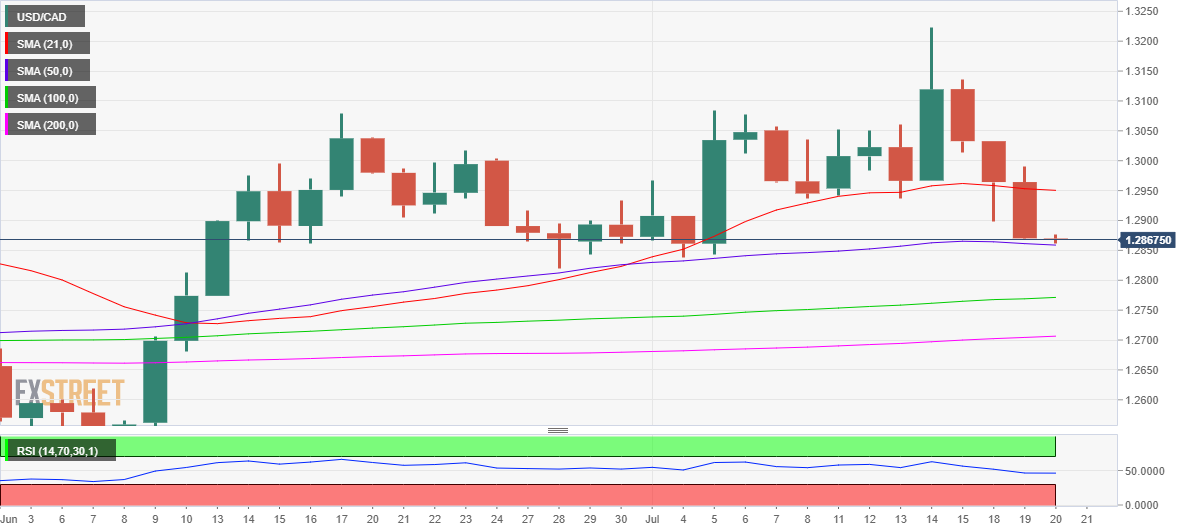
On the other hand, the bulls need to recover the barrier of 1.2900 to initiate a significant recovery. Next, the downsloping SMA 21 at 1.2950 will offer strong resistance.
A sustained break above this level is critical to trigger a further rally towards the level of 1.3000 and beyond.
USD/CAD additional levels
Source: Fx Street
With 6 years of experience, I bring to the table captivating and informative writing in the world news category. My expertise covers a range of industries, including tourism, technology, forex and stocks. From brief social media posts to in-depth articles, I am dedicated to creating compelling content for various platforms.


