
- USD/CAD bounces off weekly lows around 1.3520 and approaches 1.3600.
- In general, the strength of the dollar and the fall in oil prices maintain the recovery of USD/CAD.
- USD/CAD Price Analysis: With a bullish bias, and a daily close above 1.3600, it could pave the way towards 1.3700.
The USD/CAD It erases Tuesday’s losses and forms a tong bottom candlestick pattern as it failed to break above the 50-day EMA at 1.3583. In addition, a sudden change in the mood of the markets increased the appetite for the US dollar (USD) due to its safe haven status. At the time of writing, the USD/CAD pair is trading at 1.3590 after hitting a low of 1.3485.
US Pending Home Sales Tumble, Though Sentiment Supports Dollar.
Wall Street extends its losses for the second day in a row. The National Association of Realtors reported that Pending Home Sales in the United States (US) fell 4% MoM versus expectations for a 4.6% contraction, which was better than estimated. However, it fell to its lowest level outside of the pandemic, in data going back to 2001. On a year-over-year basis, pending sales fell 37.8% year-over-year, down from the 37% drop.
Meanwhile, the Richmond Fed’s manufacturing index improved to 1, surpassing the previous month’s contraction, to -9.
Although sentiment improved throughout the Asian and European sessions, courtesy of China’s easing of Covid-19 restrictions, it has soured lately. Fears that China’s full reopening could spark another virus outbreak weighed on Wall Street, which turned red. Chinese authorities began issuing Hong Kong residents travel permits and passports as it prepares to reopen borders on January 8.
The strength of the US dollar is keeping the Canadian dollar (CAD) under pressure. The US Dollar Index (DXY), which measures the value of the greenback against a basket of currencies, rose 0.18% to 104.454, boosted by higher US Treasury yields. The 10-year yield rises three and a half points to 3,879%.
Another reason keeping the Loonie under pressure is the price of oil, with WTI extending its losses below $80.00 a barrel, after failing to break above the 200 day EMA at $81.54.
For next week, the US economic calendar will publish the Initial Claims for Unemployment Benefits for the week ending December 23, while the Canadian calendar will release the CFIB Business Barometer on Friday.
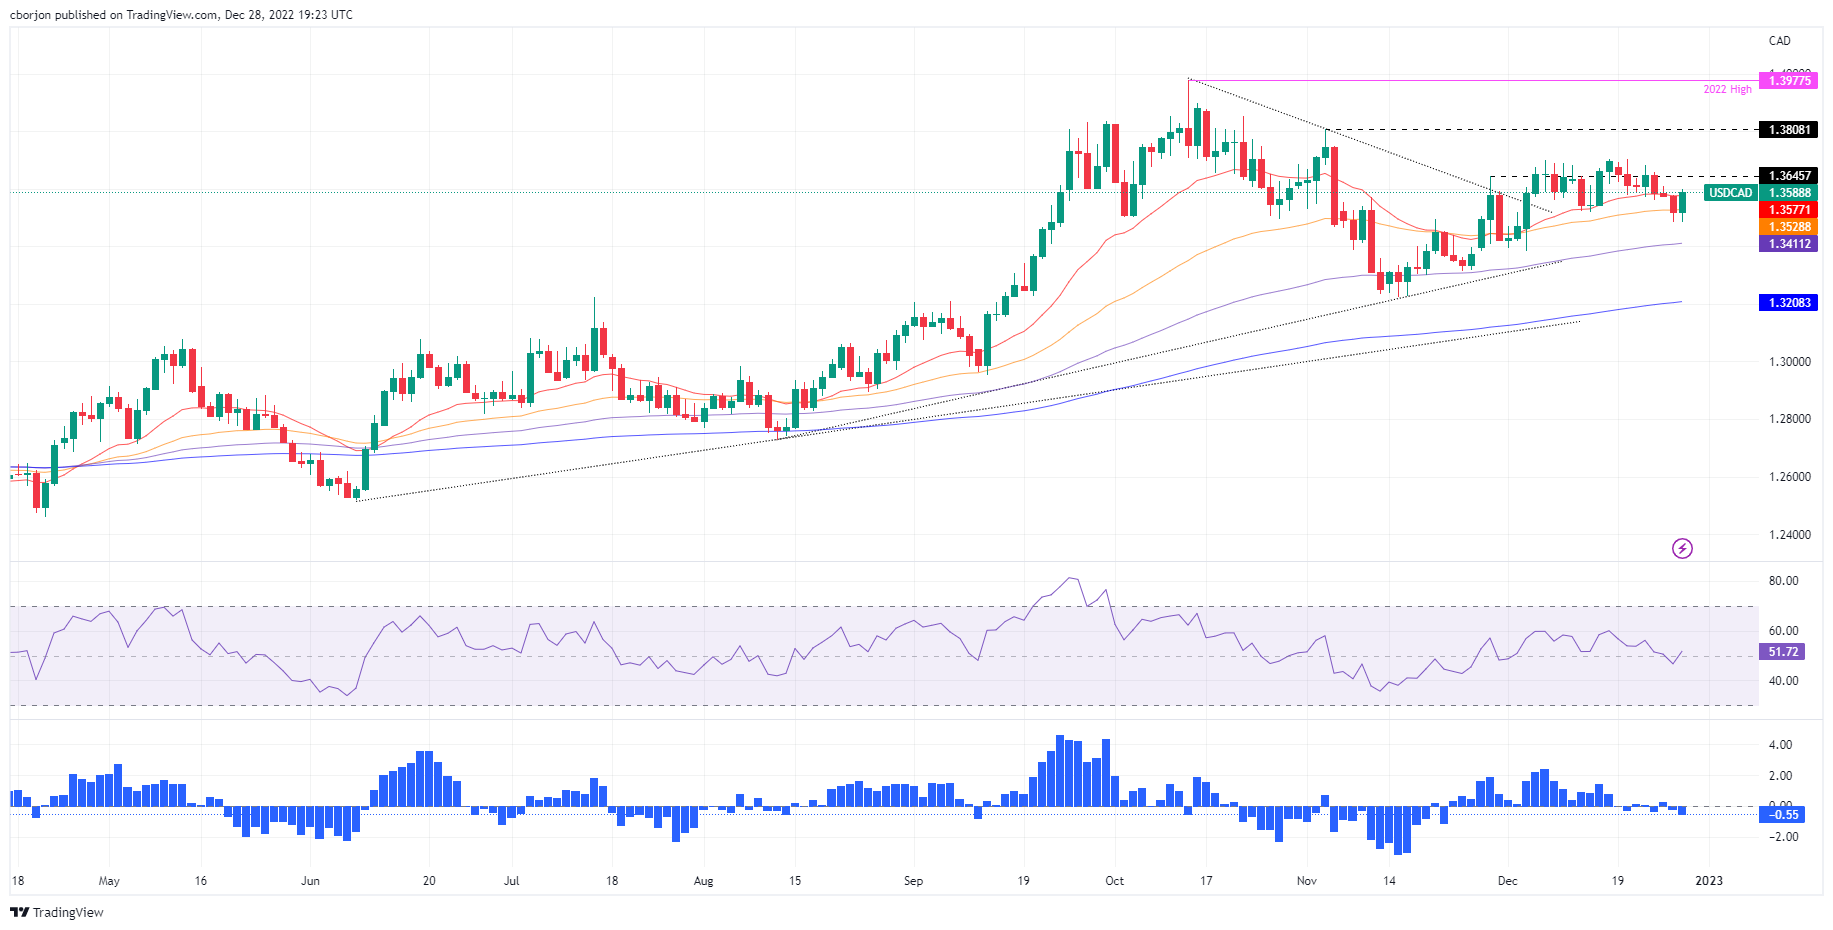
USD/CAD Price Analysis: Technical Perspective
From a technical point of view, the USD/CAD pair continues to advance and is approaching 1.3600. The Relative Strength Index (RSI) moved higher above the midline of 50, while the Rate of Change (RoC) continues to show preliminary signs that selling pressure is starting to ease. Another reason to wait for more upside is the bounce off the 50 day EMA at 1.3528 and a break above 1.3600.
If USD/CAD breaks above the 1.3600 signal, next resistance would be the Dec 23 high at 1.3658, followed by the Dec 22 pivot top at 1.3684. Once these levels are broken, the next stop would be 1.3700.
Source: Fx Street
I am Joshua Winder, a senior-level journalist and editor at World Stock Market. I specialize in covering news related to the stock market and economic trends. With more than 8 years of experience in this field, I have become an expert in financial reporting.


