
- USD/CAD reached a daily high of 1.3384 after four days of losses.
- The strength of the dollar and the fall in oil prices weigh on the CAD.
- All eyes are on Tuesday’s US inflation data.
During Monday’s session, the USD/CAD snapped a four-day losing streak and jumped to a daily high of 1.3384 as the US dollar held its ground ahead of an eventful week. On the other hand, the CAD seems to be suffering from the collapse of oil prices, which have registered losses of more than 3% on the day.
Focus is on CPI data and Fed decision
The markets seem to be waiting for the next release of the US Consumer Price Index (CPI) data for the month of May to define the direction to follow. The headline data is expected to slow to a 4.1% yoy rate, while the core index is expected to decline from 5.5% yoy previously to 5.3%.
In addition, CME’s FedWatch tool currently suggests a 25% chance of an interest rate hike for next Wednesday’s Federal Reserve (Fed) decision. On the other hand, rate cuts are no longer expected by the end of the year, so market participants will be watching Fed Chairman Powell’s press conference on Wednesday for clues on future direction.
On the Canadian side, CAD bulls appear to have taken a step back and are consolidating the gains from last week’s surprising 25 basis point (bp) rise by the Bank of Canada (BoC). Furthermore, the CAD appears to be facing further weakness amid heavy oil losses, as WTI (Western Texas Intermediate) is down 3.60% on the day, trading at the $67.45 level.
USD/CAD Levels to Watch
According to the daily chart, the USD/CAD shows a neutral to bearish outlook for the short term. Even though the indicators have gained some traction, they are still trading in negative territory. The Relative Strength Index (RSI) is below its midline, but is sloping upward. Meanwhile, the moving average divergence (MACD) printed a declining red bar, indicating diminishing selling momentum.
The 1.3350 zone level is key for USD/CAD to maintain its bullish bias. If broken, the price could see a steeper decline towards the 1.3310 zone and towards the multi-month low at 1.3300. Furthermore, the next resistance for USD/CAD is seen at the 1.3380 zone, followed by the 1.3400 psychological signal and the 1.3450 zone.
USD/CAD daily chart
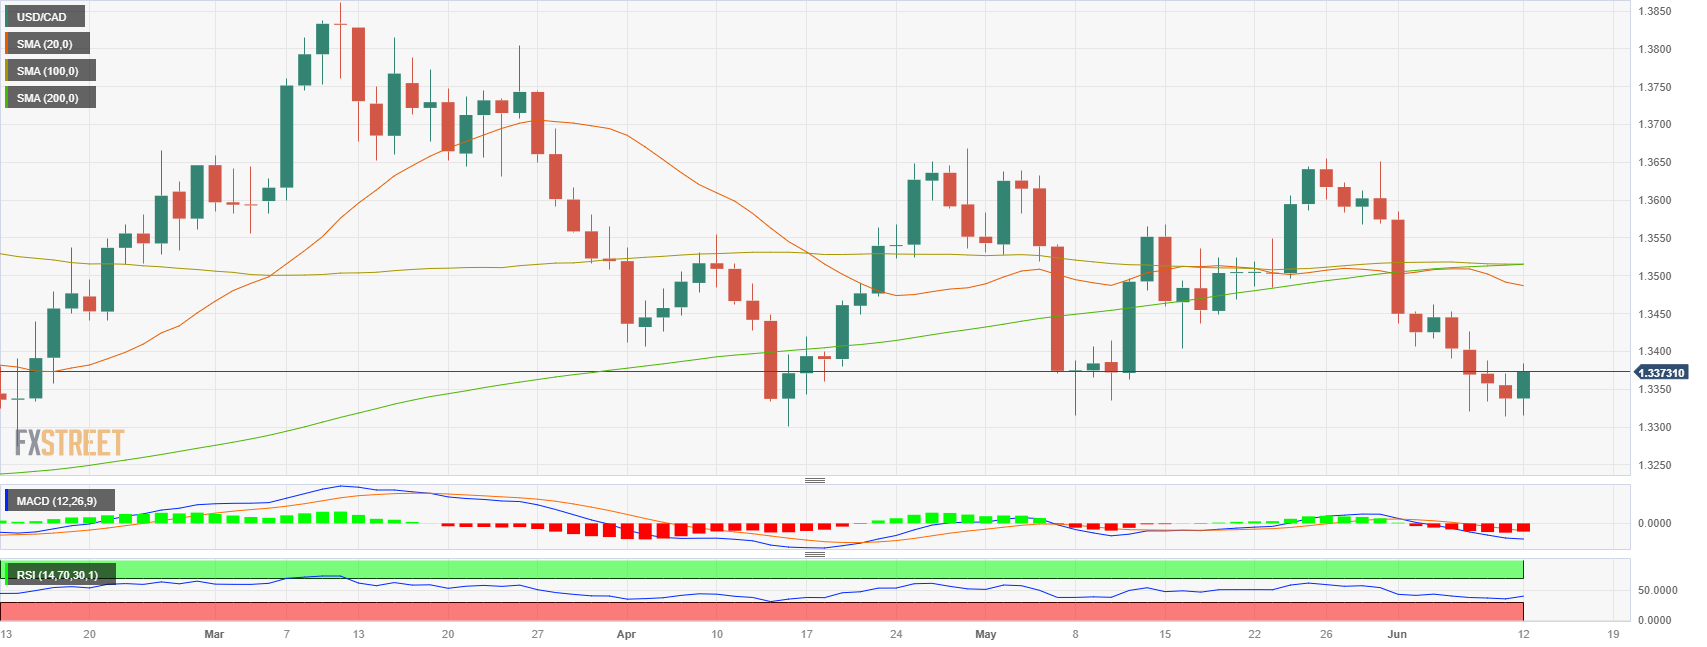
Source: Fx Street
I am Joshua Winder, a senior-level journalist and editor at World Stock Market. I specialize in covering news related to the stock market and economic trends. With more than 8 years of experience in this field, I have become an expert in financial reporting.


