
- US adds 339,000 jobs, beating estimates, but USD/CAD remains tepid.
- The CAD gains momentum on the back of a 1.70% rise in WTI crude oil prices.
- Uncertainty about the Fed’s rate hike in July casts a shadow over the future trajectory of the USD.
He USD/CAD posts modest losses after an excellent US jobs report is likely to keep the US Federal Reserve (Fed) on the brakes on the economy, despite recent comments moderates that support a pause. However, the US dollar (USD) continued to weaken while the loonie (CAD) strengthened. At the time of writing, USD/CAD is trading at 1.3428, down 0.16%.
Jobs Growth Numbers Fail to Encourage USD; WTI Crude Oil Rise Lifts CAD, Sending USD/CAD Jolt
The USD/CAD pair stopped its decline around the 200-day EMA at 1.3417, following the release of the US Non-Farm Payrolls report for May, as reported by the US Department of Labor. The US economy created 339,000 jobs, beating estimates of 190,000, though the unemployment rate rose to 3.7% from 3.4%, the lowest level in 53 years.
Despite data supporting dollar strength, the USD/CAD pair was flat after hitting a daily low of 1.3406 ahead of the Non-Farm Payrolls release.
Against this backdrop, crude oil prices were another factor driving the CAD, with Western Texas Intermediate (WTI), the US crude benchmark, regaining ground gaining 1.70%, at $71.33 a barrel, coupled with adversity momentum. to risk, which keeps the dollar pressured through the pair from some losses.
The Dollar Index (DXY), a measure that tracks the value of the dollar against six currencies, rose 0.31% to 103.888, supported by increased bets on a July rate hike by the Fed. According to the recent update to the CME’s FedWatch tool, the Federal Reserve is likely to hold current interest rates steady for this month. However, the forecast for July is rather less definitive, with the probability of a rate change teetering at about 50.7%.
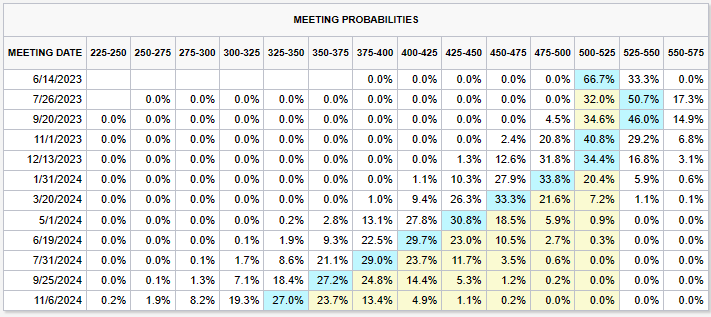
Source: CME Fed Watch Tool
An absent Canadian economic agenda left USD/CAD traders leaning on US dollar dynamism. However, recent data showing strong growth in the Canadian economy puts pressure on the Bank of Canada (BoC) to continue tightening the economy, given the threat of high inflationary pressures.
USD/CAD Price Analysis: Technical Perspective
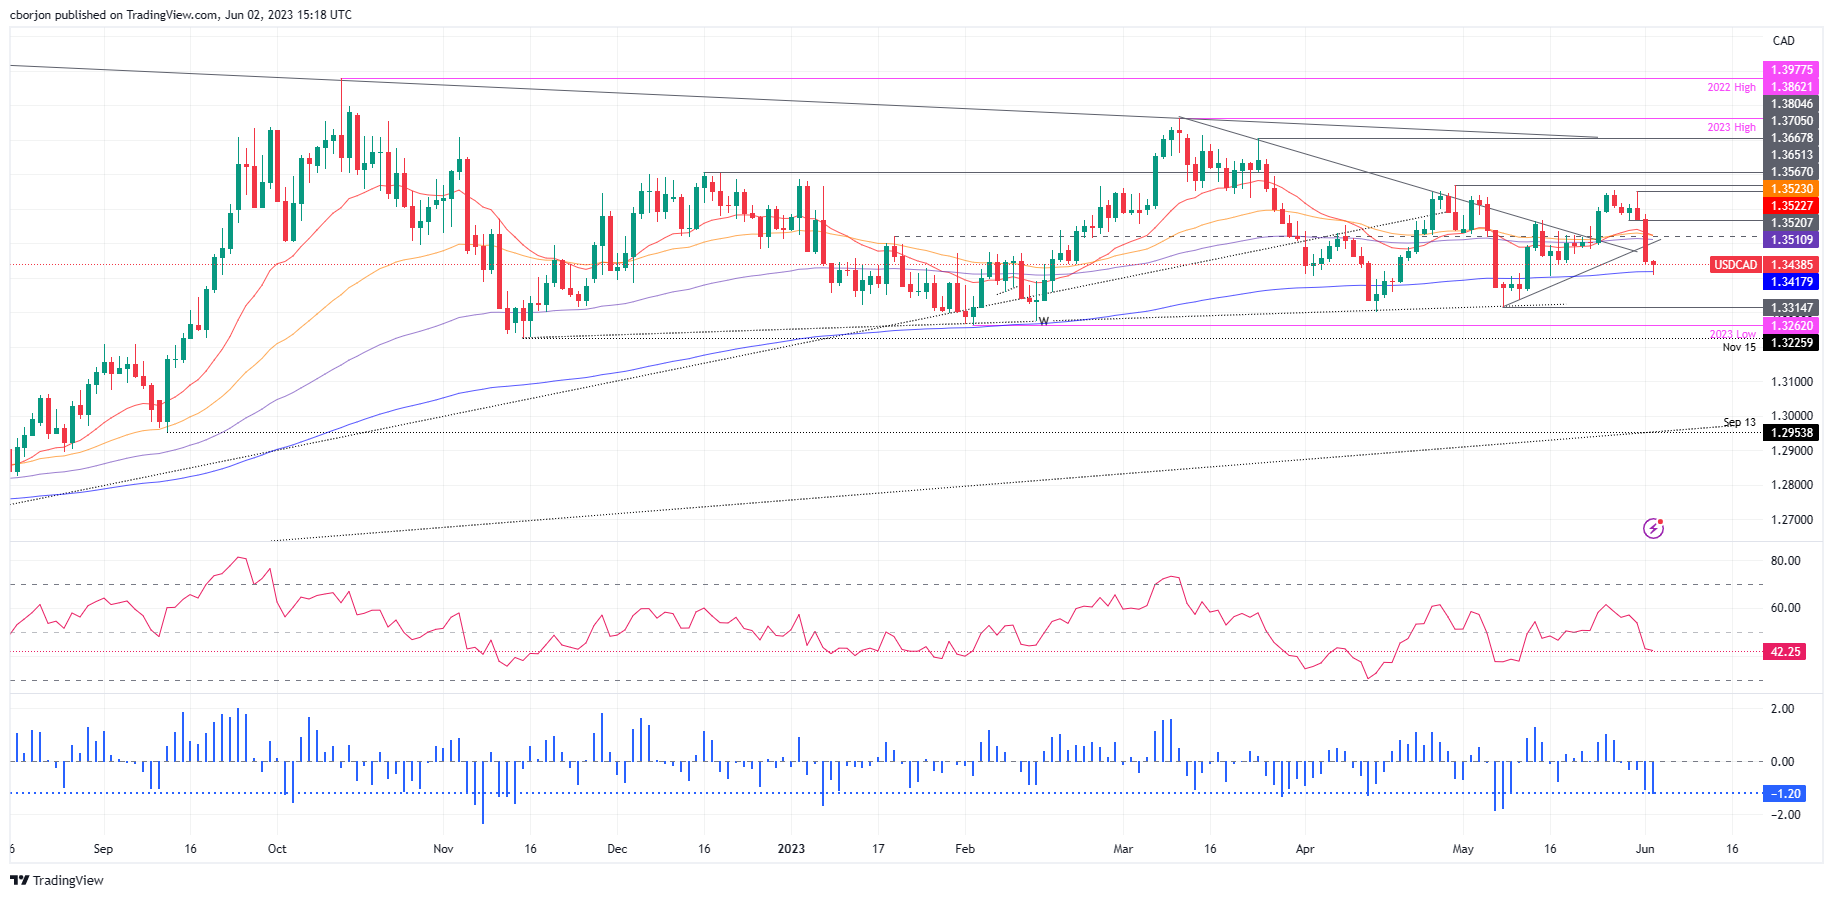
Technically, USD/CAD faced solid support at the 200 day EMA, and the buyers piled in, pushing the price 30 points higher. However, the relative strength index (RSI) and the 3-day exchange rate (RoC) in bearish territory suggest a short-term bearish action. Therefore, USD/CAD could come under pressure, with support at the 200-day EMA at 1.3417, before testing 1.3400. A break below would expose the May low at 1.3314. Conversely, the first resistance for USD/CAD would be the 1.3500 figure, followed by the 100 day EMA at 1.3510.
Source: Fx Street
I am Joshua Winder, a senior-level journalist and editor at World Stock Market. I specialize in covering news related to the stock market and economic trends. With more than 8 years of experience in this field, I have become an expert in financial reporting.


