- The Loonie appreciates against the US dollar after the Bank of Canada’s 50 basis point rate hike.
- The Bank of Canada sees further tightening as the core CPI remains at 5%.
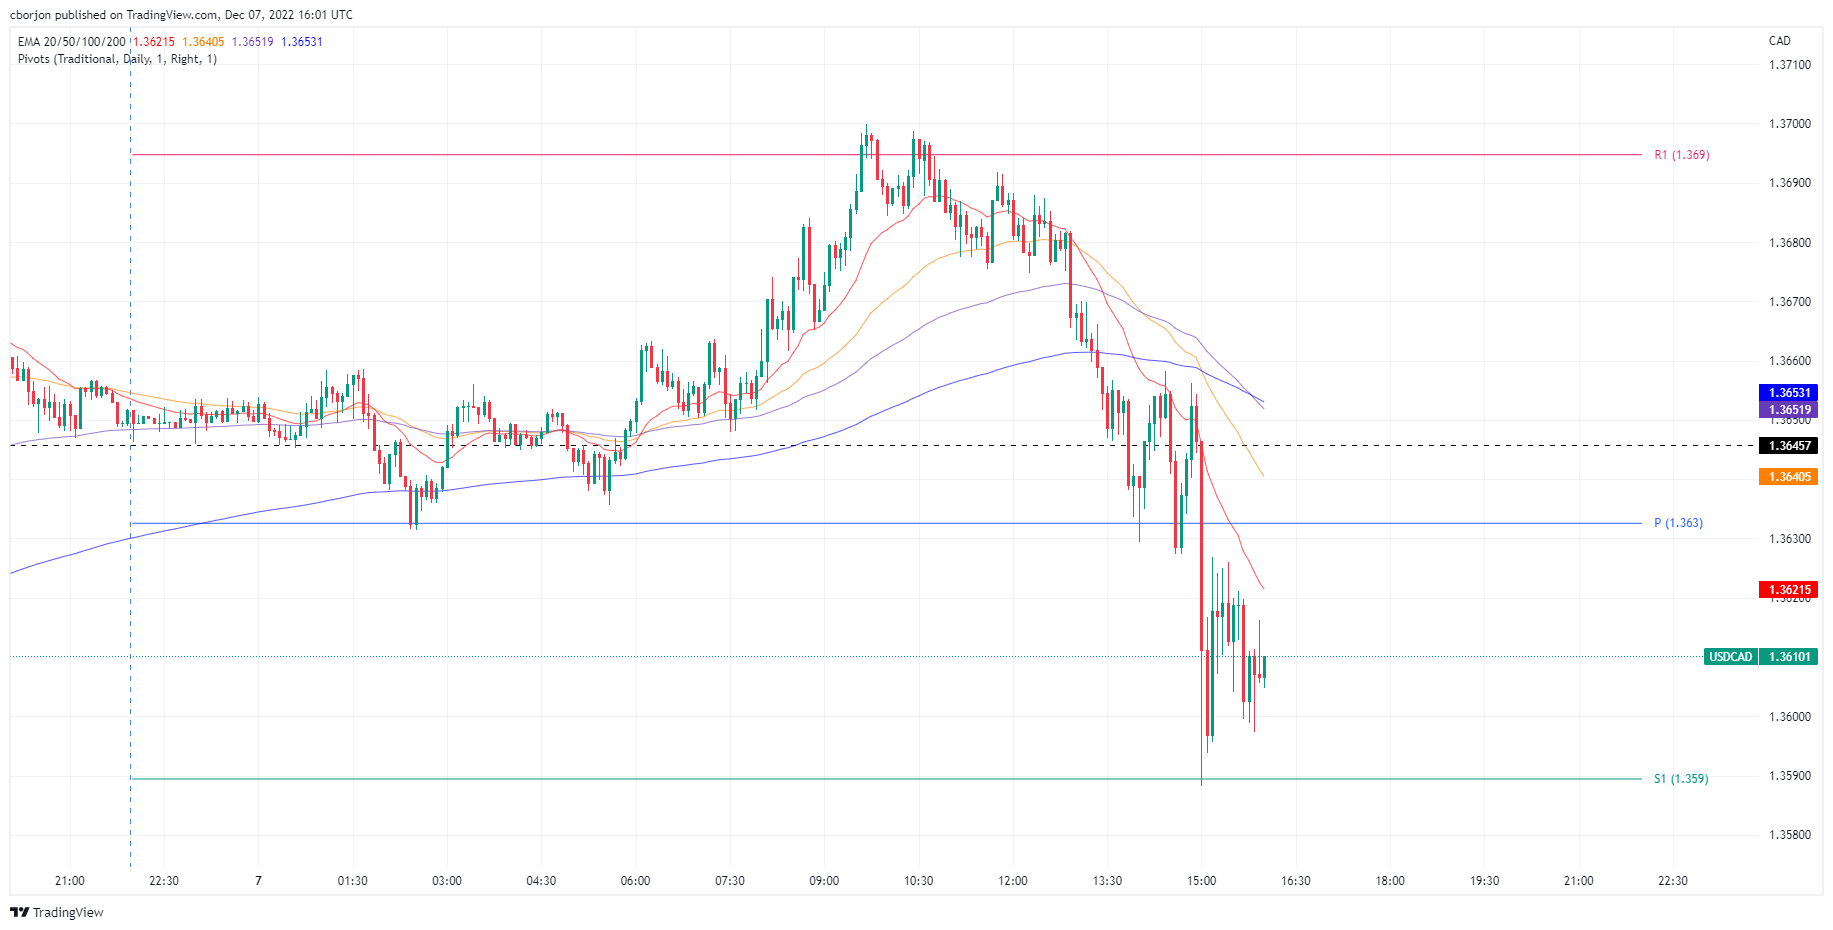
- Following the Bank of Canada decision, the USD/CAD pair fell from 1.3660 to its daily low of 1.3588.
The USD/CAD fell during the American session after the Bank of Canada (BOC) raised rates by 50 basis points, from 3.75% to 4.25%, in line with analysts’ expectations, causing a drop from around 1.3700 to 1.3505. At the time of writing, USD/CAD continues to show volatility and is trading around 1.3600-1.3615.
Observations from the Bank of Canada on its state of monetary policy
The Bank of Canada mentioned that inflation around the world remains elevated and widespread. Despite slowing growth, the BoC said the US economy was proving resilient, with consumption rising and the job market “overheating.” They commented that supply bottlenecks are easing, although geopolitical events could disrupt supply.
The BOC acknowledged that the labor market is tight and that third-quarter GDP was stronger than expected, commenting that “there are increasing signs that a tighter monetary policy is holding back domestic demand, consumption moderated in the third quarter and real estate market activity continues to decline.”
The Governing Council noted that inflation remains too high and that short-term inflation expectations remain high. Traders should know that the CPI stands at 6.9%, while the core CPI hovers around 5%.
The BOC ended its statement by stating that further rate hikes would be necessary to balance supply and demand, adding that quantitative tightening (QT) “is complementing policy rate hikes.”
USD/CAD reaction to Bank of Canada decision
The USD/CAD 5 minute chart showed the pair oscillating around the daily pivot point of 1.3630 and the 1.366 area before the decision hit the news. Following the headline release, USD/CAD fell towards its daily low of 1.3587 before stabilizing in the 1.3600-1.3620 range, below the 20 EMA at 1.3623.

USD/CAD
| Overview | |
|---|---|
| Last price today | 1.3607 |
| daily change today | -0.0046 |
| today’s daily variation | -0.34 |
| today’s daily opening | 1.3653 |
| Trends | |
|---|---|
| daily SMA20 | 1.3417 |
| daily SMA50 | 1,357 |
| daily SMA100 | 1.3308 |
| daily SMA200 | 1.3039 |
| levels | |
|---|---|
| previous daily high | 1.3676 |
| previous daily low | 1.3571 |
| Previous Weekly High | 1.3646 |
| previous weekly low | 1.3381 |
| Previous Monthly High | 1.3808 |
| Previous monthly minimum | 1.3226 |
| Fibonacci daily 38.2 | 1.3636 |
| Fibonacci 61.8% daily | 1.3611 |
| Daily Pivot Point S1 | 1,359 |
| Daily Pivot Point S2 | 1.3528 |
| Daily Pivot Point S3 | 1.3485 |
| Daily Pivot Point R1 | 1.3696 |
| Daily Pivot Point R2 | 1.3738 |
| Daily Pivot Point R3 | 1.3801 |
Source: Fx Street
I am Joshua Winder, a senior-level journalist and editor at World Stock Market. I specialize in covering news related to the stock market and economic trends. With more than 8 years of experience in this field, I have become an expert in financial reporting.


