
- USD/CAD fell on market sentiment and high oil prices.
- A US dollar bid would keep USD/CAD under heavy pressure as USD/CAD targets 1.3500.
- USD/CAD Price Analysis: Would continue to head lower unless buyers conquer 1.3600.
He CAD spread its gains against USD for three straight days, buoyed by a boost in risk appetite and general US dollar weakness. The dollar is pressured by expectations of a less aggressive US Federal Reserve (Fed). The pair USD/CAD trades at 1.3569 after hitting a high of 1.3616.
CAD driven by high oil prices, risk appetite and USD weakness
USD/CAD continued its slide on rising oil prices as the Western Texas Intermediate (WTI) rose more than 6% on a weekly basis. Canada is one of the world’s leading exporters of crude oil and natural gas. As a result, higher energy prices tend to support the loonie.
On the other hand, the weakening of the US dollar caused a further decline in the USD/CAD pair, which fell to a three-week low. However, the Dollar Index (DXY), a barometer of the value of the greenback against a basket of six currencies, has pared some of its losses, gaining 0.23% to 102,665.
Traders should keep in mind that the Canadian dollar, as a risk currency, would be subject to weakening if geopolitical tensions increase or sentiment changes. As long as investor sentiment remains upbeat, USD/CAD has room for another leg lower, and could test the 100 day EMA at 1.3520.
In terms of economic data, highlighted on the US agenda were February pending home sales, which rose 0.8% m/m, above estimates for a 0.3% drop. In annual terms, they decreased by 21.1%, below the 29.4% plunge expected.
On the Canadian front, the agenda was attended by the Deputy Governor of the Bank of Canada (BoC), Toni Gravelle. Gravelle did not talk about monetary policy, but said the BoC is prepared to intervene if the banking system comes under pressure. He added that the BOC’s quantitative tightening (QT) program would run its course in the first half of 2025.
USD/CAD Technical Analysis
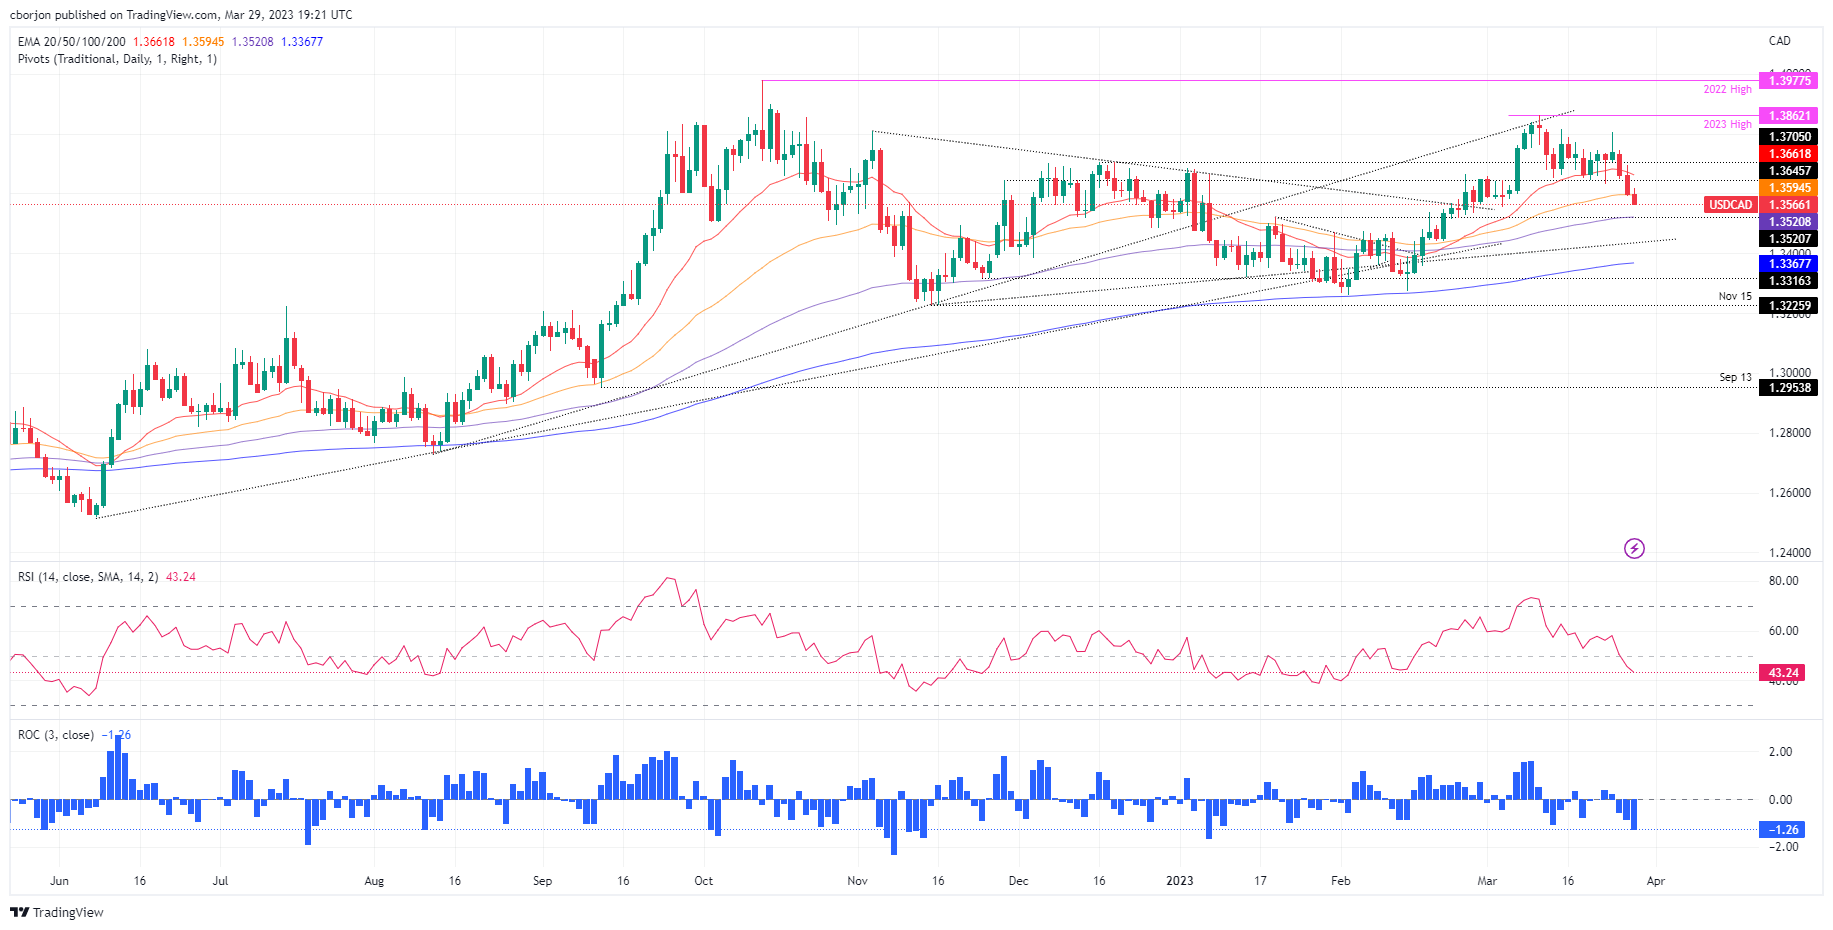
USD/CAD remains biased to the downside after dipping below the 50-day EMA at 1.3594. A drop below 1.3550 will expose the 100 day EMA at 1.3520, before testing 1.3500. Once broken, a supportive trend line could be tested around 1.3420/30 before pulling back to 1.3400.
On the other hand, if buyers of the USD/CAD recapture the 50 day EMA at 1.3594, it could pave the way to test 1.3600, followed by the 20 day EMA.
Source: Fx Street
I am Joshua Winder, a senior-level journalist and editor at World Stock Market. I specialize in covering news related to the stock market and economic trends. With more than 8 years of experience in this field, I have become an expert in financial reporting.


