
- USD/CAD falls to 1.3500 due to multiple headwinds.
- The US Dollar continues to correct following the weakness of the US ISM Services PMI.
- Rising oil prices, due to supply concerns, boosted the Canadian dollar.
The USD/CAD pair falls sharply towards the psychological support of 1.3500 in the European session on Thursday. The Canadian Dollar is facing an intense sell-off as the US Dollar weakens and global oil prices remain generally strong.
The US Dollar Index (DXY), which values the US Dollar against six major currencies, corrects to 104.00 as the weak US ISM Services PMI report for March casts doubt on economic resilience. The yield on the 10-year US Treasury bond rose as Federal Reserve (Fed) officials demanded more data before considering rate cuts.
On Wednesday, Fed Chair Jerome Powell said in a speech: “Recent readings on job gains and inflation have been higher than expected,” Powell maintained the baseline that rate cuts They will begin later this year only when policymakers “have greater confidence that inflation is moving downward sustainably.”
Meanwhile, rising global oil prices have strengthened the Canadian dollar. West Texas Intermediate (WTI) futures on NYMEX are trading slightly lower near $85.35 but have risen significantly this week. Oil prices rose after Ukraine's drone attacks on Russian oil refineries heightened supply concerns. It should be noted that Canada is the largest exporter of oil to the United States, and rising oil prices strengthen the Canadian dollar.
Looking ahead, the US dollar and Canadian dollar will be guided by employment data for their respective economies, which will be released on Friday.
USD/CAD appears close to exploding the ascending triangle pattern formed on daily time. The upward boundary of this pattern is located from the December 27 low at 1.3177, while the horizontal resistance is drawn from the December 7 high at 1.3620. The chart pattern shows a strong contraction in volatility and a breakout can occur in either direction.
The pair falls below the 20-day EMA near 1.3520, suggesting that short-term appeal is weak.
The 14-period Relative Strength Index (RSI) is oscillating within the range of 40.00-60.00, indicating indecision among investors.
A bearish move below the February 22 low at 1.3441 would expose the asset to the February 9 low at 1.3413. A break below this last level would extend the decline towards the January 15 low at 1.3382.
On the other hand, the Canadian Dollar would see a fresh rise if it breaks above the December 7 high at 1.3620. This would take the asset towards the May 26 high at 1.3655, followed by the round resistance level of 1.3700.
USD/CAD daily chart
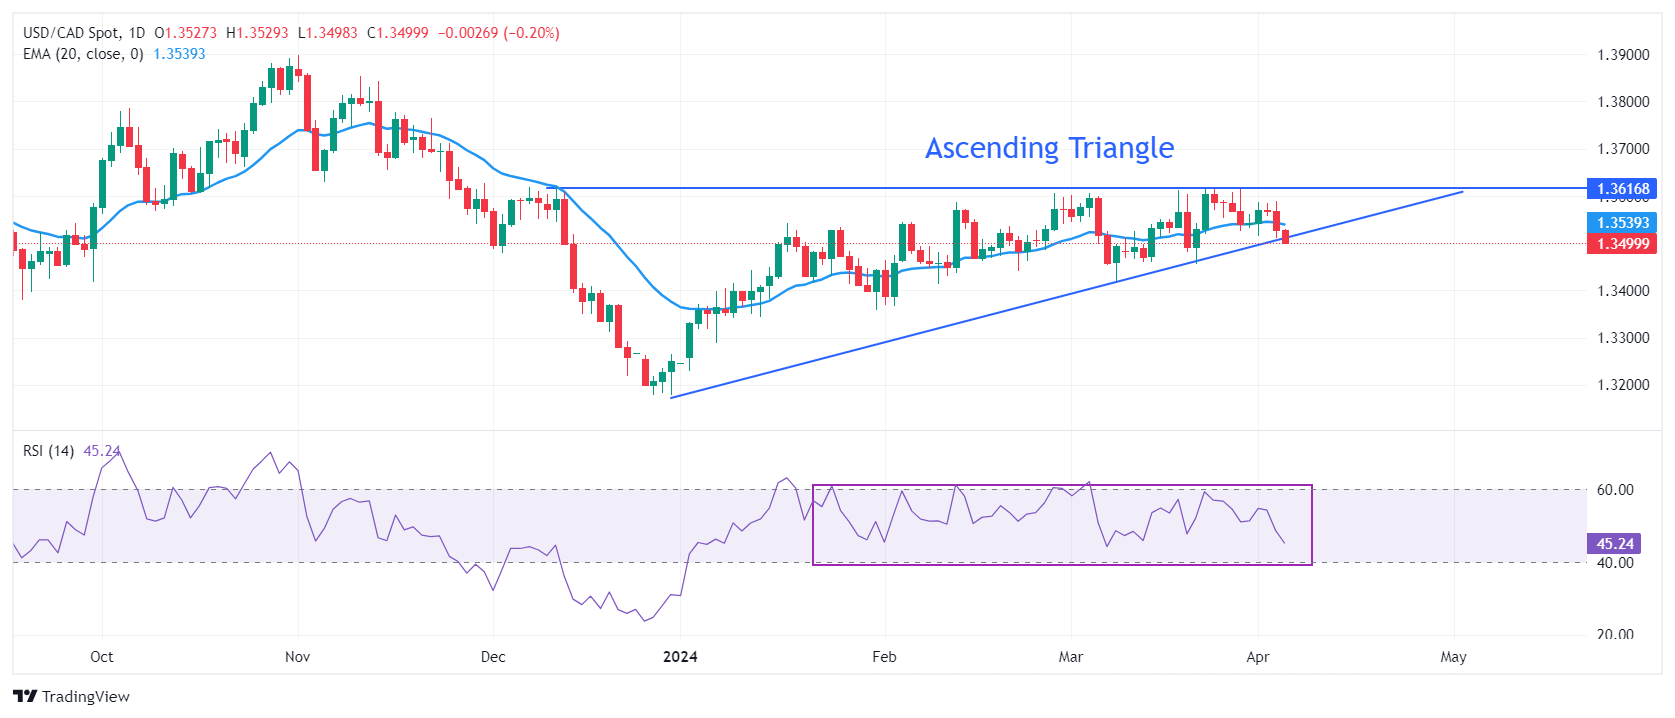
Source: Fx Street
I am Joshua Winder, a senior-level journalist and editor at World Stock Market. I specialize in covering news related to the stock market and economic trends. With more than 8 years of experience in this field, I have become an expert in financial reporting.


