
- USD/CAD loses traction near 1.3400 despite US Dollar strength.
- Bearish outlook remains intact below the key EMA; The RSI indicator is in bearish territory below the 50 midline.
- The first support level is seen at 1.3350; the immediate resistance level will emerge at 1.3440.
The USD/CAD pair is trading lower for the fourth consecutive day during the early hours of the European session on Tuesday. The rise in oil prices, amid geopolitical tensions in the Middle East, boosts the CAD, a currency linked to commodity prices, and weighs on the USD/CAD pair. The pair is currently trading around 1.3405, losing 0.04% on the day.
Technically, USD/CAD maintains the bearish bias as the pair is below the 50 and 100 EMA on the 4-hour chart. The path of least resistance for USD/CAD is to the downside as the Relative Strength Index (RSI) is in bearish territory below the 50 midline.
A bearish break below the Bollinger Bands lower boundary at 1.3393 would cause a drop to the January 11 low at 1.3350. If selling occurs below this level, the psychological support at 1.3300 will be exposed and the January 2 low at 1.3228 could be reached.
To the upside, the first barrier for the pair is located at the 100 period EMA at 1.3440. The other bullish screen to watch is the 50 EMA at 1.3450. Further up, the next hurdle will be the Bollinger Bands upper boundary at 1.3516, followed by the January 25 high at 1.3534.
USD/CAD 4-hour chart
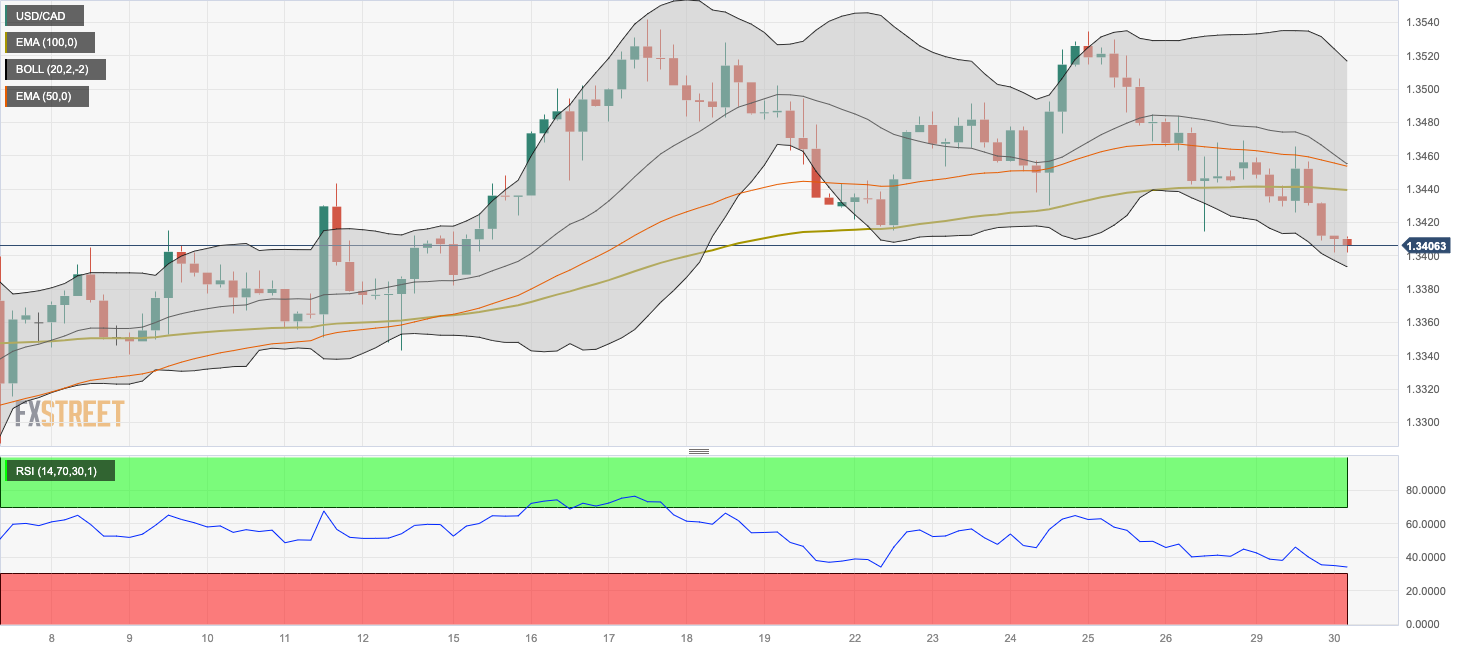
Source: Fx Street
I am Joshua Winder, a senior-level journalist and editor at World Stock Market. I specialize in covering news related to the stock market and economic trends. With more than 8 years of experience in this field, I have become an expert in financial reporting.


