- USD/CAD makes a nice bounce from a multi-week low amid a rebound in demand for dollars.
- Crude oil prices underpin the Loonie and act as a headwind amid a risk-positive tone.
- Traders also seem reluctant to place bets ahead of the release of Canadian GDP and US PCE inflation.
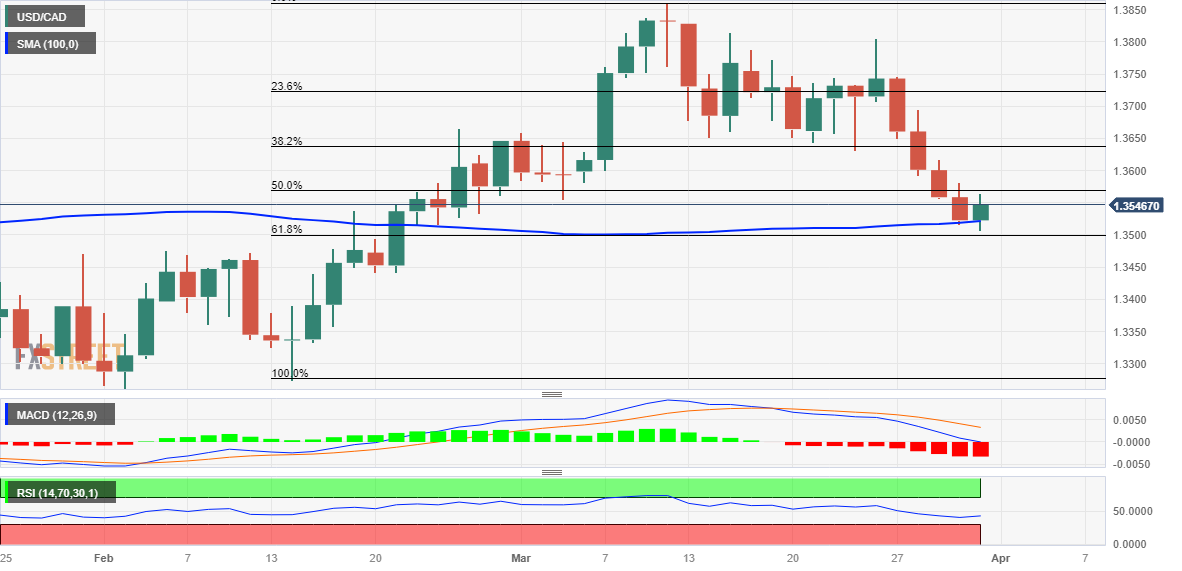
The pair USD/CAD It shows resistance below the 100-day SMA and attracts some buying near the key psychological 1.3500 level, or a 5.5-week low hit the previous Friday. The pair maintains its buying tone ahead of the North American session and is currently around the 1.3550 area, just a few points below the daily high.
The US dollar (USD) regains some positive traction on the last day of the week and is seen as a key factor acting as a tailwind for the USD/CAD pair. However, prevailing market risk appetite is keeping any significant advance in the safe-haven dollar limited. Aside from this, the recent bullishness in crude oil prices, to a nearly three-week high, lends some support to the commodity-linked Loonie and helps cap the pair’s gains.
Traders also seem reluctant to make aggressive bets ahead of the release of Canadian monthly GDP and the US core PCE price index, the Fed’s preferred inflation gauge. The USD/CAD pair, for now, appears to have stalled its positive intraday move near the 50% fibonacci retracement level of the February-March rally. A sustained move above could lift the pair beyond 1.3600, towards the 1.3640 zone, or the 61.8% Fibonacci level.
A buy move beyond the 1.3650 zone would negate any short-term downtrends and pave the way towards the 1.3700 zone en route to the 1.3720 zone, or the 23.6% Fibonacci level.
On the other hand, 1.3500 represents the 61.8% Fibonacci level and should now act as a pivot point, which if broken will be seen as a new trigger for bears. The USD/CAD pair could then become vulnerable and accelerate the decline towards intermediate support near the 1.3455-1.3450 horizontal zone. The pair could fall to the 1.3400 zone on the way to the next relevant support near the 1.3330-1.3325 zone.
USD/CAD daily chart

Key levels to watch
USD/CAD
| Overview | |
|---|---|
| Last price today | 1.3549 |
| Today I change daily | 0.0026 |
| today’s daily variation | 0.19 |
| today’s daily opening | 1.3523 |
| Trends | |
|---|---|
| daily SMA20 | 1.3698 |
| daily SMA50 | 1,354 |
| daily SMA100 | 1.3519 |
| daily SMA200 | 1.3372 |
| levels | |
|---|---|
| previous daily high | 1.3581 |
| previous daily low | 1.3516 |
| Previous Weekly High | 1.3804 |
| previous weekly low | 1.3631 |
| Previous Monthly High | 1.3666 |
| Previous monthly minimum | 1.3262 |
| Fibonacci daily 38.2 | 1.3541 |
| Fibonacci 61.8% daily | 1.3556 |
| Daily Pivot Point S1 | 1.3499 |
| Daily Pivot Point S2 | 1.3474 |
| Daily Pivot Point S3 | 1.3433 |
| Daily Pivot Point R1 | 1.3564 |
| Daily Pivot Point R2 | 1.3605 |
| Daily Pivot Point R3 | 1,363 |
Source: Fx Street
I am Joshua Winder, a senior-level journalist and editor at World Stock Market. I specialize in covering news related to the stock market and economic trends. With more than 8 years of experience in this field, I have become an expert in financial reporting.


