
- USD/CAD falls from 1.3700 as US Dollar plunges ahead of US core PCE inflation reading.
- Durable goods orders in the US barely increased in May.
- The Canadian economy is estimated to have expanded 0.3% in April.
The USD/CAD pair falls in an attempt to break decisively above the round resistance level of 1.3700 in the American session on Thursday. USD/CAD declines as US Dollar (USD) corrects with focus on United States (US) Core Personal Consumption Expenditure (PCE) Price Index data for May due on Friday.
Investors will pay close attention to underlying inflation as it will provide new clues about the outlook for interest rates. Soft inflation figures would increase expectations of early rate cuts by the Federal Reserve (Fed), while high inflation figures would decrease them.
In the American session, the US Dollar has been under pressure even though US Durable Goods Orders increased surprisingly in May. New orders for durable goods rose 0.1%, while economists projected a decline at a similar pace.
Meanwhile, the next movement of the Canadian Dollar will be forecast by the monthly Gross Domestic Product (GDP) report for April. The report is expected to show the Canadian economy expanded 0.3% after a stagnant performance in March.
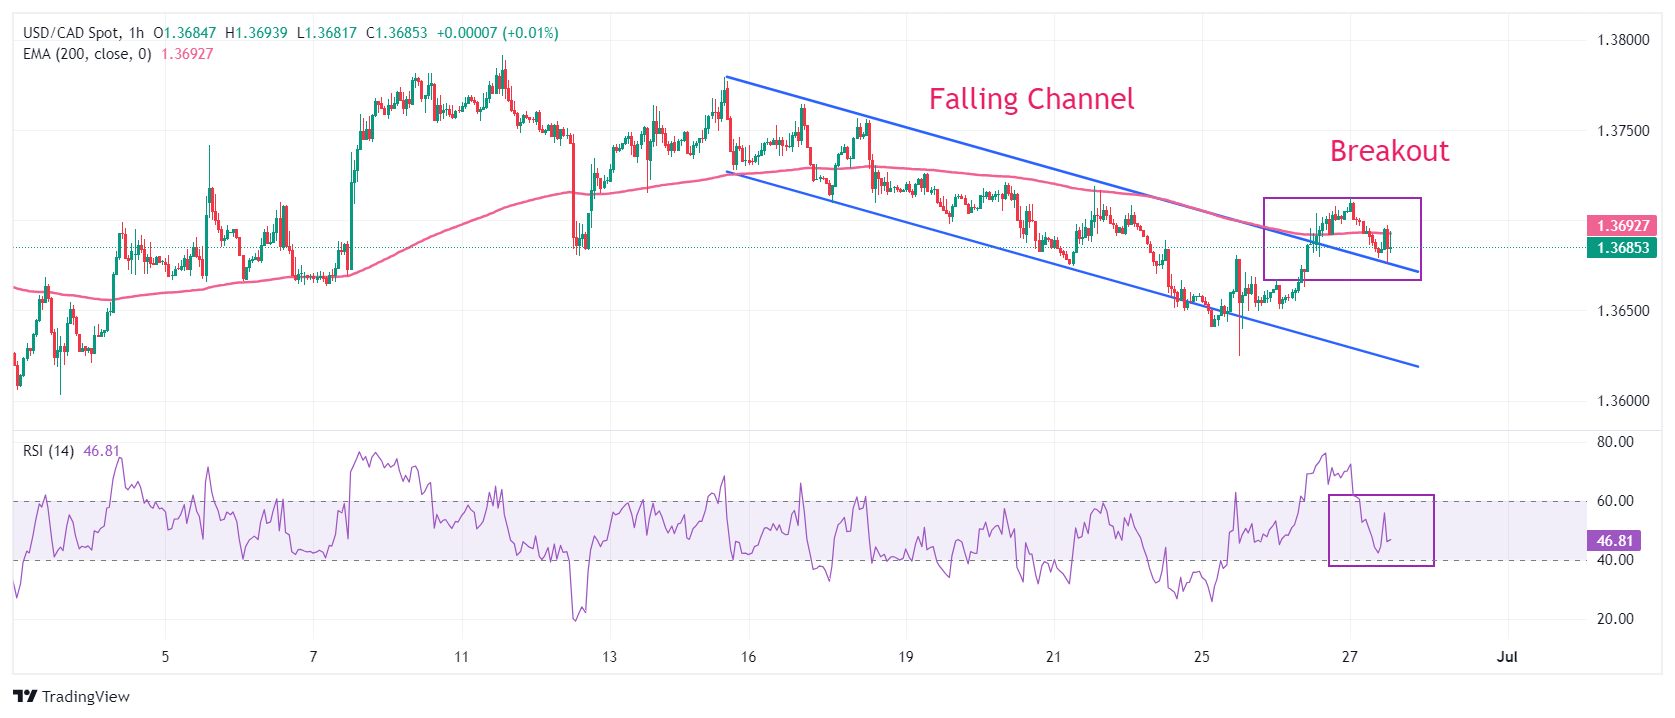
USD/CAD tests the breakout region of the descending channel chart pattern formed on one-hour time frame. A breakout of the mentioned chart formation results in a bullish reversal. The asset gains strength to decisively break above the 200 hourly exponential moving average (EMA), which is trading around 1.3700.
The 14-period RSI pulls back within the 40.00-60.00 range, suggesting consolidation ahead.
A new buying opportunity would arise if the asset breaks above the June 11 high near 1.3800. This would take the asset towards the April 17 high at 1.3838, followed by the November 1, 2023 high at 1.3900.
In an alternative scenario, a downside break below the June 7 low at 1.3663 will expose the asset to the May 3 low around 1.3600 and the April 9 low around 1.3547.
USD/CAD Hourly Chart
Economic indicator
Gross Domestic Product (MoM)
The GDP published by Statistics Canada is the total value of goods and services produced in Canada. GDP is considered a measure of global economic activity and indicates the rate of growth of a country’s economy. A reading above expectations is bullish for the Canadian dollar, while a reading below is bearish.
Source: Fx Street
I am Joshua Winder, a senior-level journalist and editor at World Stock Market. I specialize in covering news related to the stock market and economic trends. With more than 8 years of experience in this field, I have become an expert in financial reporting.


