
- USD/CAD could break the main support at the 1.3450 level.
- Technical indicators suggest a possible shift in momentum towards a bearish trend.
- A break above 1.3500 could lead the pair to test the weekly high at 1.3536 and the main barrier at 1.3550.
The pair USD/CAD moves lower for the second day in a row, trading around 1.3460 during the European session on Thursday. The pair is positioned just above the main support level of 1.3450. The 14-day Relative Strength Index (RSI) technical analysis is positioned below 50, suggesting bearish momentum for the USD/CAD pair.
A break below the main support could pressure the USD/CAD pair lower and test the 38.2% Fibonacci retracement level support level at 1.3430. If the pair breaks this last level, it could explore the psychological support zone at 1.3400 level followed by the 50.0% retracement level at 1.3381.
Furthermore, the moving average convergence divergence (MACD) lag indicator for the USD/CAD pair suggests a possible momentum shift towards a bearish trend in the market. This appreciation derives from the positioning of the MACD line above the center line but below the signal line. Traders may choose to wait for clearer directional sentiment from the MACD indicator before making trading decisions.
To the upside, the USD/CAD pair could encounter significant resistance at the psychological level of 1.3500. A decisive break above the psychological resistance could generate positive sentiment, pushing the pair to test the resistance zone around the weekly high at 1.3536 and the main barrier at 1.3550. Further bullish momentum could bring the pair closer to the February high at 1.3586.
USD/CAD: Daily Chart
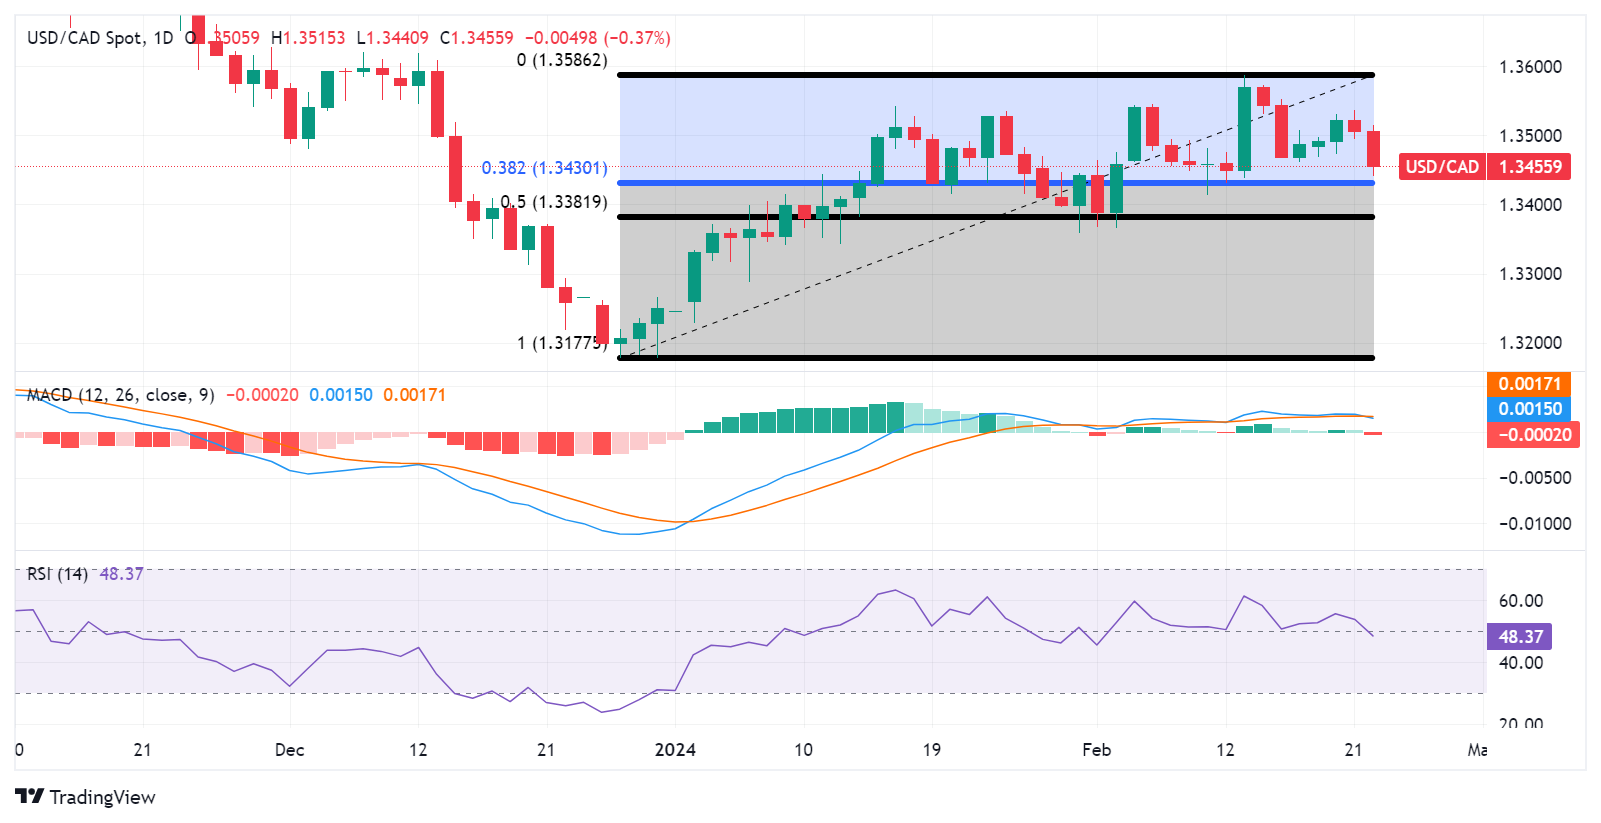
Source: Fx Street
I am Joshua Winder, a senior-level journalist and editor at World Stock Market. I specialize in covering news related to the stock market and economic trends. With more than 8 years of experience in this field, I have become an expert in financial reporting.


