
- USD/CAD consolidates below 1.3600 as attention focuses on US inflation and BoC monetary policy.
- The BoC is expected to keep interest rates at 5%.
The USD/CAD pair struggles to find direction as investors await US Consumer Price Index (CPI) data for March, due out on Wednesday. USD/CAD is trading sideways below the resistance of the 1.3600 round level in the European session on Tuesday. US inflation data for March is expected to provide some clues as to when the Federal Reserve (Fed) might start cutting interest rates.
US annual headline inflation is expected to have risen to 3.4% from 3.2% in February. In the same period, core inflation, which excludes the volatility of food and energy prices, would have fallen slightly to 3.7% from 3.8%.
Weak inflation figures could raise speculation about a reduction in funding costs by the Fed after the June meeting, while bullish figures could shift rate cut expectations to the second half of this year.
Meanwhile, the Canadian dollar will dance to the tune of the Bank of Canada's (BoC) interest rate decision, which will be announced on Wednesday. The BoC is expected to keep interest rates unchanged at 5%. Therefore, investors will focus on the outlook for interest rates. The BoC could give dovish guidance as the Canadian labor market faces the harsh consequences of higher interest rates. Furthermore, the BoC's preferred measure of inflation, the core CPI, fell to 2.1% in February.
USD/CAD is slightly below the horizontal resistance of the ascending triangle formation on the daily time frame, drawn from the December 7 high at 1.3620. The upward frontier of the mentioned pattern is located from the December 27 low at 1.3177. The chart pattern shows a strong contraction in volatility and a breakout can occur in either direction.
The 200-day exponential moving average (EMA) near 1.3500 remains a crucial support for the US Dollar bulls.
Meanwhile, the 14-period Relative Strength Index (RSI) is oscillating within the range of 40.00-60.00, indicating indecision among market participants.
The Canadian Dollar asset would see a fresh rise if it breaks above the April 5 high at 1.3648. This would take the pair to the round resistance of 1.3700, followed by the November 22 high at 1.3765.
On the other hand, a bearish move below the February 22 low at 1.3441 would expose the asset to the February 9 low at 1.3413. A break below the latter would extend the decline towards the January 15 low at 1.3382.
USD/CAD daily chart
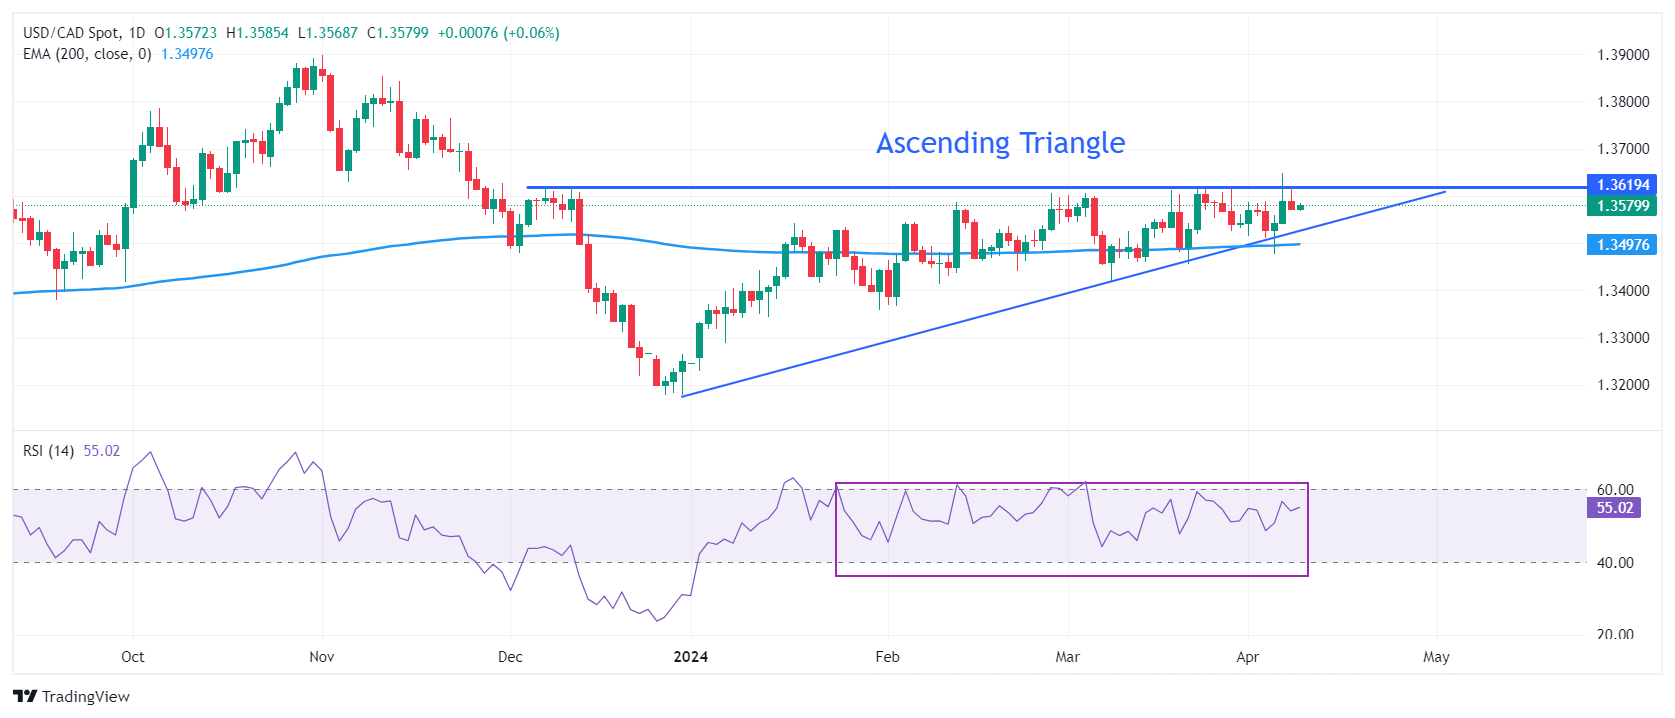
Source: Fx Street
I am Joshua Winder, a senior-level journalist and editor at World Stock Market. I specialize in covering news related to the stock market and economic trends. With more than 8 years of experience in this field, I have become an expert in financial reporting.


