
- USD/CAD is trading in a tight range below the 1.3600 level on Monday.
- The technical situation favors the bulls and supports the prospects for further gains.
- A convincing break below the 200-day SMA will negate the positive bias.
The USD/CAD pair fails to capitalize on Friday’s strong rally from just below the psychological 1.3500 level, or a two-week low, and begins the new week on a dovish tone. The pair remains below the round 1.3600 level at the start of the European session, although the short-term bias seems to be skewed to the bullish side and suggests that the path of least resistance is to the upside.
Expectations that the Federal Reserve (Fed) will leave interest rates unchanged at its September policy meeting, coupled with a positive risk tone, weigh on the safe-haven US dollar (USD) and act as a wind against for the USD/CAD pair. Market participants, however, seem convinced that the Fed will keep rates higher for longer and have been pricing in the possibility of a further 25 basis point hike later this year. This remains support for high US Treasury yields and should help limit the dollar’s slide.
On the other hand, growing concern about a further global economic recession dwarfs the optimism generated by China’s new stimulus measures and supports the prospects for further appreciation of the dollar in the near term. The Canadian dollar (CAD), meanwhile, is weighed down by data on Friday, which shows that the economy contracted during the second quarter. This, coupled with a slight pullback in crude oil prices, could weigh on the commodity-priced CAD and support the USD/CAD pair.
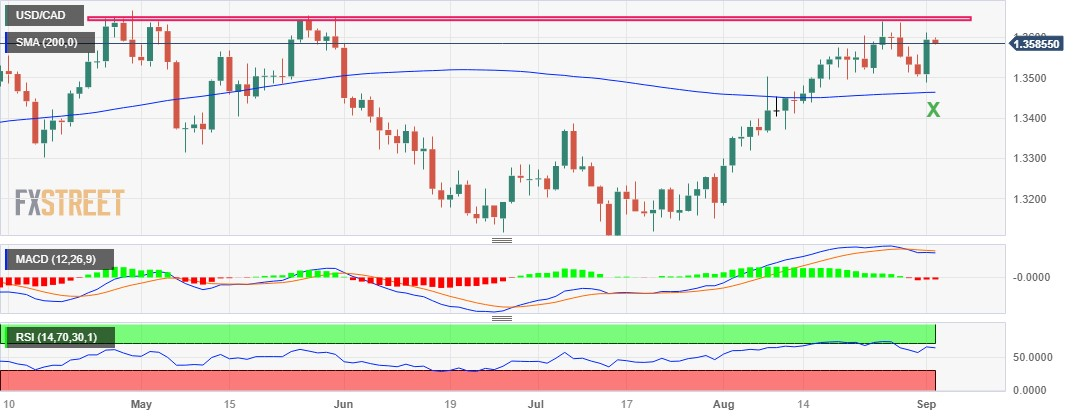
From a technical point of view, the recent breakout of the 200-day SMA and the appearance of new buying on Friday favor the bulls. Furthermore, oscillators on the daily chart are comfortably in positive territory and have broken out of the overbought zone a bit. This reinforces the short-term positive outlook for the USD/CAD pair, although it would be prudent to wait to break above the 1.3600 level before positioning for further gains.
The next major hurdle is near the 1.3635-1.3640 zone, or the multi-month high reached in August. The USD/CAD pair could reach the 1.3700 level on its way to the 1.3740-1.3745 resistance zone. Momentum could extend further towards the round 1.3800 level, above which the pair could rally to the yearly high around the 1.3860 zone touched in March.
On the flip side, any significant decline is more likely to find decent support near the 1.3555-1.3550 zone. A further drop could be seen as a buying opportunity near the 1.3500 level and remain capped near the 1.3460-1.3455 region, or the 200-day SMA. This last level should act as a turning point, which if broken decisively would shift the bias in favor of the bears and leave USD/CAD vulnerable. The pair could fall to the 1.3400 level on its way to the next relevant support near the 1.3370 area.
USD/CAD daily chart
USD/CAD additional technical levels
Source: Fx Street
I am Joshua Winder, a senior-level journalist and editor at World Stock Market. I specialize in covering news related to the stock market and economic trends. With more than 8 years of experience in this field, I have become an expert in financial reporting.


