- USD/CAD rises above 1.3550 amid uncertainty ahead of key events.
- Canadian inflation is expected to have accelerated in February.
- Investors will focus on the Fed's guidance on interest rates.
The USD/CAD pair rises towards 1.3580 during the European session on Tuesday after breaking above the two-day consolidation formed in a range of 1.3510-1.3550. The pair advances as uncertainty over key events has dampened the risk appetite of market participants.
S&P500 futures record slight losses in the European session, indicating a risk-averse sentiment. The DXY Dollar Index continues its winning streak for the fourth consecutive session and refreshes its weekly high at 103.87, amid uncertainty before the Federal Reserve (Fed) decision on interest rates, which will be announced on Wednesday.
The CME's FedWatch tool shows that the central bank is certain to keep interest rates unchanged in the 5.25%-5.50% range. Investors will focus on clues on rate cuts by the Fed, currently expected at the June policy meeting.
Meanwhile, the Canadian Dollar's next move will be guided by the Canadian Consumer Price Index (CPI) data for February, which will be released today at 12:30 GMT. Headline inflation is expected to have grown at a faster rate of 3.1% year-on-year compared to the 2.9% recorded in January.
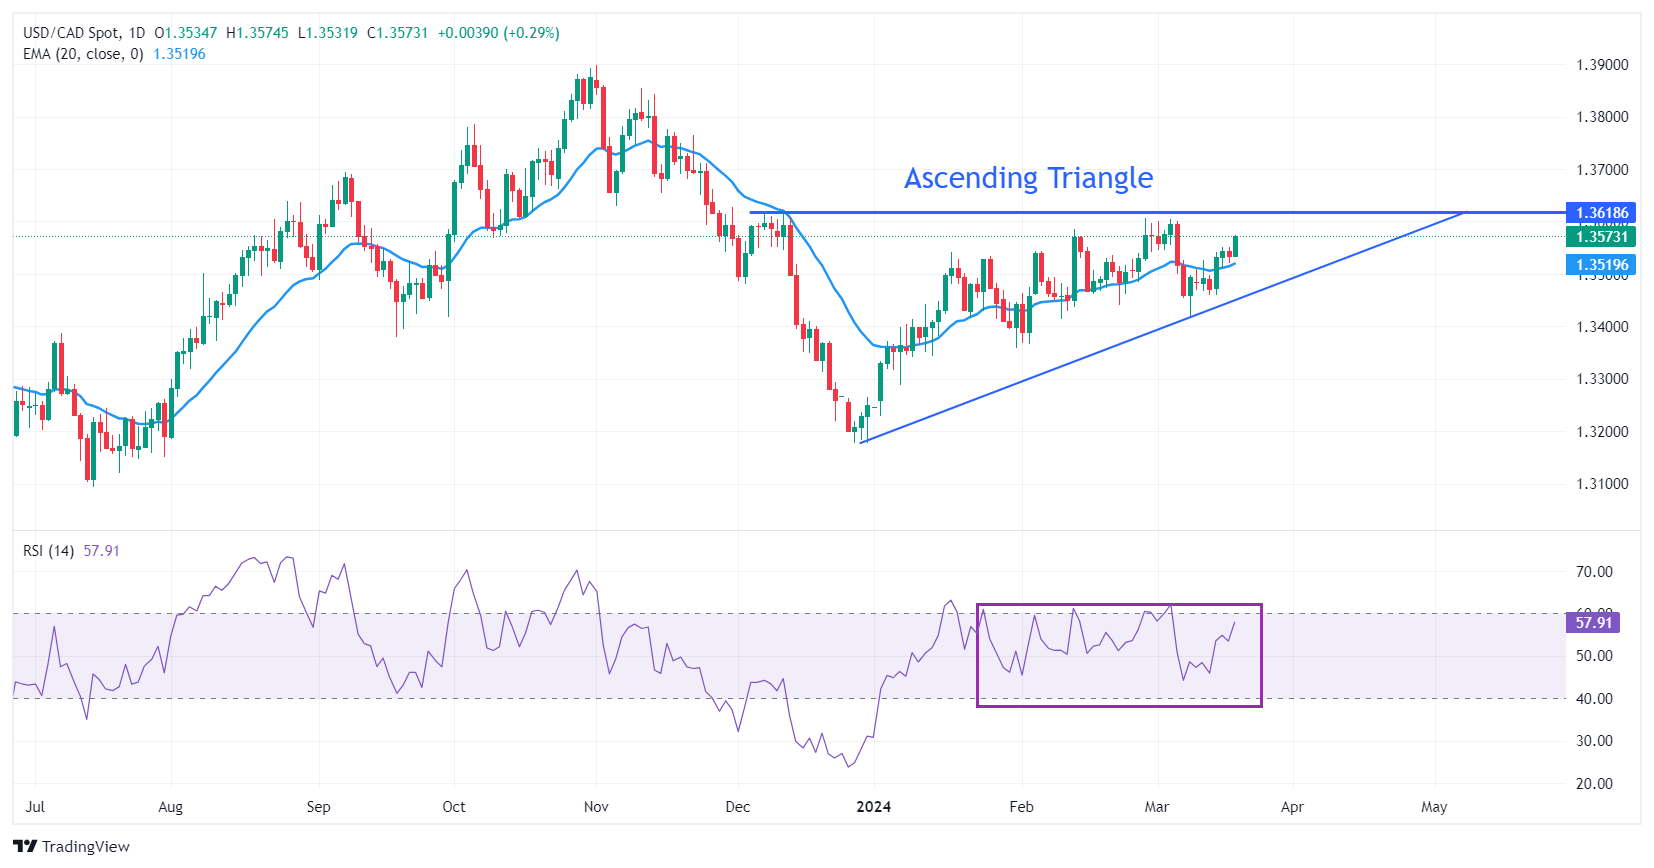
The USD/CAD pair is approaching the horizontal resistance of the ascending triangle formed on the daily chart from the December 7 high at 1.3620. The ascending line of this pattern is located from the December 27 low at 1.3177. The chart pattern shows a sharp contraction in volatility.
The near-term appeal is bullish as the 20-day EMA near 1.3520 continues to support the pair's bulls.
The 14-period Relative Strength Index (RSI) is oscillating within the range of 40-60, indicating indecision among investors.
The pair would see a fresh rise if it breaks above the December 7 high at 1.3620. This would take USD/CAD towards the May 26 high at 1.3655, followed by the round resistance level at 1.3700.
On the other hand, a bearish move below the February 22 low at 1.3441 would expose the pair to the February 9 low at 1.3413. A break below this last level would extend the decline towards the January 15 low at 1.3382.
USD/CAD daily chart
USD/CAD additional technical levels
| Overview | |
|---|---|
| Latest price today | 1.3571 |
| Today I change daily | 0.0037 |
| Today's daily change | 0.27 |
| Today daily opening | 1.3534 |
| Trends | |
|---|---|
| daily SMA20 | 1.3523 |
| 50 daily SMA | 1.3486 |
| SMA100 daily | 1.3514 |
| SMA200 Journal | 1.3481 |
| Levels | |
|---|---|
| Previous daily high | 1.3552 |
| Previous daily low | 1.3521 |
| Previous weekly high | 1.3552 |
| Previous weekly low | 1.3459 |
| Previous Monthly High | 1.3606 |
| Previous monthly low | 1.3366 |
| Daily Fibonacci 38.2 | 1.3533 |
| Fibonacci 61.8% daily | 1,354 |
| Daily Pivot Point S1 | 1.3519 |
| Daily Pivot Point S2 | 1.3505 |
| Daily Pivot Point S3 | 1.3489 |
| Daily Pivot Point R1 | 1,355 |
| Daily Pivot Point R2 | 1.3566 |
| Daily Pivot Point R3 | 1.3581 |
Source: Fx Street
I am Joshua Winder, a senior-level journalist and editor at World Stock Market. I specialize in covering news related to the stock market and economic trends. With more than 8 years of experience in this field, I have become an expert in financial reporting.


