
- USD/CAD remains on the sidelines above 1.3700 amid uncertainty over the timing of Fed rate cuts.
- American customers sharply reduced discretionary spending, indicating a decline in purchasing power.
- Canadian retail sales are expected to have returned to a positive trajectory.
The USD/CAD pair is trading in a tight range but holding comfortably on the crucial support of 1.3700 in the European session on Wednesday. USD/CAD consolidates amid uncertainty over Federal Reserve (Fed) rate cut path due to divergence between Fed projections and market expectations on how much interest rates will be cut this year .
Fed policymakers signaled a rate cut this year in their latest dot chart. However, financial markets are firmly expecting two, as the latest United States (US) Consumer Price Index (CPI) report for May indicated that progress in the disinflation process has resumed. Additionally, May retail sales indicated that consumers sharply reduced discretionary spending. This has generated confidence among investors that inflation is progressively declining towards the 2% target.
Meanwhile, Fed officials want to see inflation decline for months before considering rate cuts. Improving expectations for Fed rate cuts have limited the rise of the US Dollar (USD). The Dollar Index (DXY), which tracks the value of the dollar against six major currencies, is trading sideways around 105.20.
On the CAD front, investors await Canadian retail sales data for April, due out on Friday. Monthly retail sales are anticipated to have returned to a positive trajectory after contracting for three consecutive months. Economic data is estimated to have increased by 0.7%.
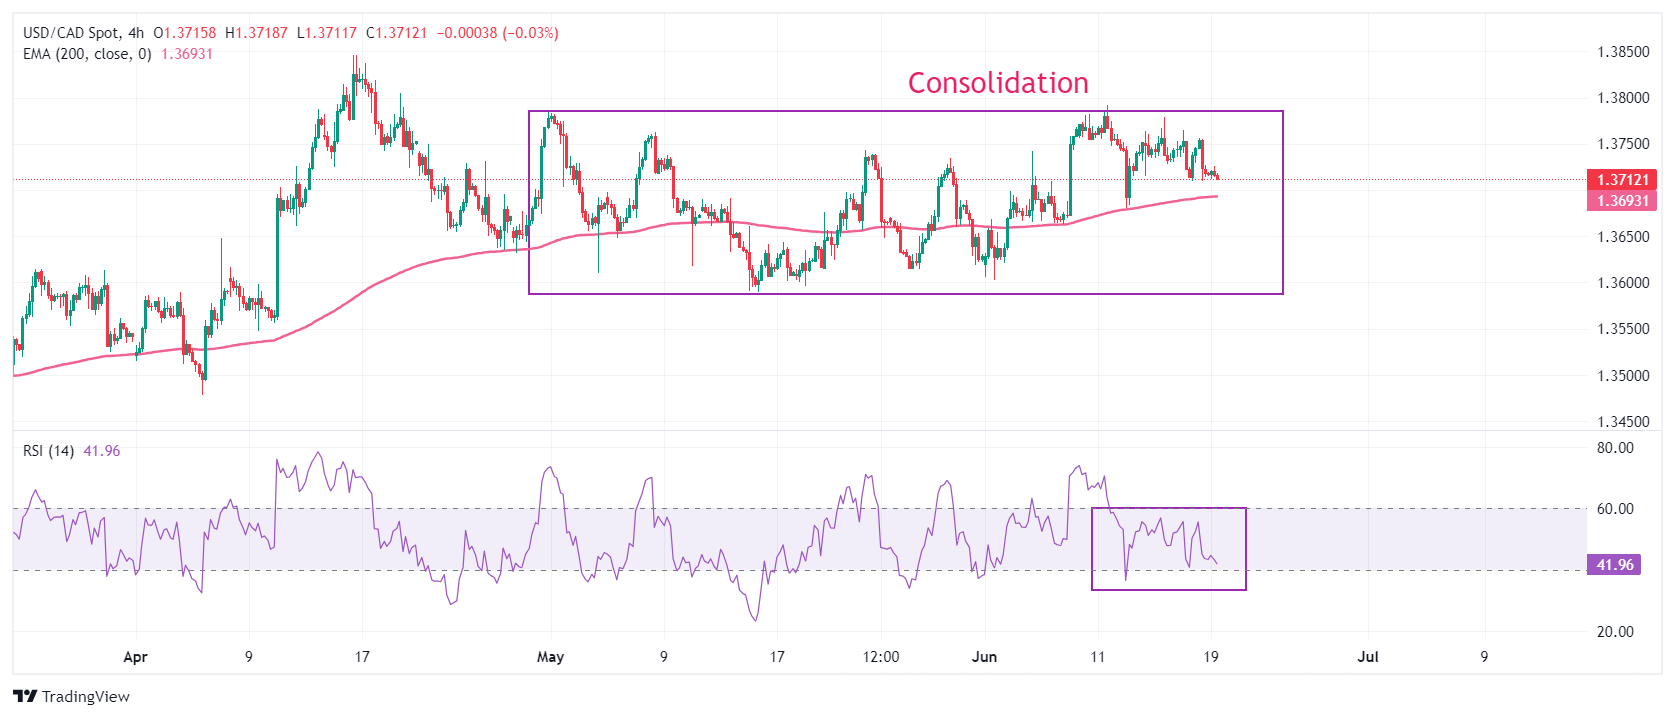
USD/CAD continues to consolidate in the 1.3600-1.3800 range for almost seven weeks. The pair is holding the 200-day EMA, which is trading around 1.3690, suggesting that the overall trend is bullish.
The 14-period Relative Strength Index (RSI) is oscillating in the range of 40.00-60.00, indicating indecision among market participants.
A new buying opportunity would arise if the pair breaks above the April 17 high at 1.3838. This would take the pair towards the November 1, 2023 high of 1.3900, followed by the psychological resistance of 1.4000.
In an alternative scenario, a downside break below the June 7 low at 1.3663 will expose the pair to the May 3 low around 1.3600 and the April 9 low around 1.3547.
USD/CAD Four-Hour Chart
Source: Fx Street
I am Joshua Winder, a senior-level journalist and editor at World Stock Market. I specialize in covering news related to the stock market and economic trends. With more than 8 years of experience in this field, I have become an expert in financial reporting.


