
- USD/CAD retreats from 1.4467, the highest level since March 2020.
- Bullish bias is in play as the 14-day RSI remains above the 50 mark.
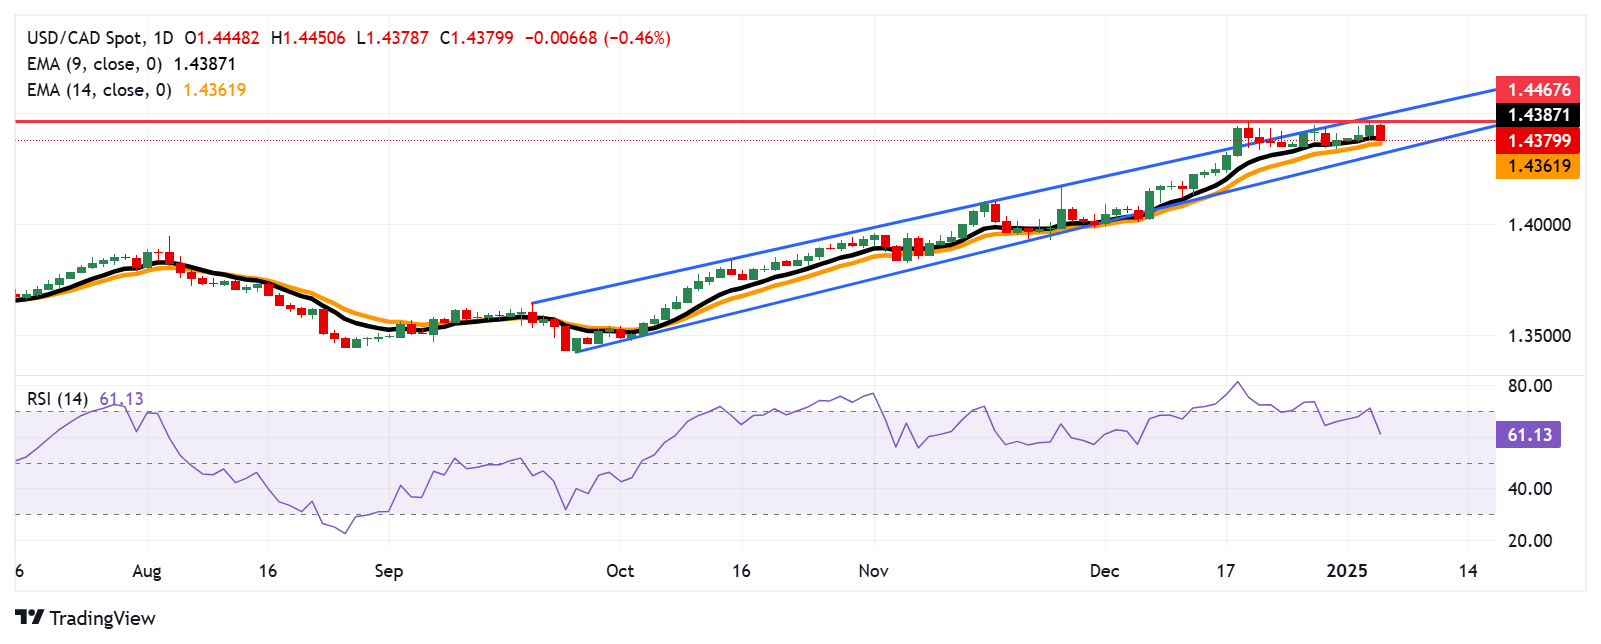
- The nine-day EMA at the 1.4387 level acts as initial support for the pair.
The USD/CAD pair ends its four-day winning streak, trading near 1.4390 during the European session on Monday. From a technical perspective, the daily chart shows the pair moving within an ascending channel, signaling a continued bullish bias.
The 14-day Relative Strength Index (RSI) remains above the 50 level, indicating sustained bullish momentum. If the RSI remains above 50, it could further strengthen the positive sentiment.
Furthermore, USD/CAD is trading above the nine-day and 14-day EMA, underscoring an uptrend and strong near-term price momentum. This lineup reflects strong buying interest and suggests the potential for further gains.
To the upside, USD/CAD continues to challenge 1.4467, the highest level since March 2020, recorded on December 19. An additional resistance level is positioned at the upper boundary of the ascending channel, near the key psychological mark of 1.4500.
Initial support lies around the nine-day EMA at 1.4387, followed by the 14-day EMA at 1.4361. If the pair breaks below these levels, additional support can be found at the lower boundary of the ascending channel, around 1.4310.
USD/CAD: Daily Chart
Canadian Dollar PRICE Today
The table below shows the percentage change of the Canadian Dollar (CAD) against major currencies today. Canadian dollar was the strongest currency against the Japanese yen.
| USD | EUR | GBP | JPY | CAD | AUD | NZD | CHF | |
|---|---|---|---|---|---|---|---|---|
| USD | -0.29% | -0.42% | 0.35% | -0.48% | -0.36% | -0.29% | -0.30% | |
| EUR | 0.29% | -0.12% | 0.60% | -0.13% | -0.01% | 0.05% | 0.03% | |
| GBP | 0.42% | 0.12% | 0.73% | -0.01% | 0.11% | 0.17% | 0.15% | |
| JPY | -0.35% | -0.60% | -0.73% | -0.81% | -0.66% | -0.58% | -0.40% | |
| CAD | 0.48% | 0.13% | 0.00% | 0.81% | 0.05% | 0.15% | 0.16% | |
| AUD | 0.36% | 0.01% | -0.11% | 0.66% | -0.05% | 0.06% | 0.04% | |
| NZD | 0.29% | -0.05% | -0.17% | 0.58% | -0.15% | -0.06% | -0.01% | |
| CHF | 0.30% | -0.03% | -0.15% | 0.40% | -0.16% | -0.04% | 0.01% |
The heat map shows percentage changes for major currencies. The base currency is selected from the left column, while the quote currency is selected from the top row. For example, if you choose the Canadian Dollar from the left column and move along the horizontal line to the US Dollar, the percentage change shown in the box will represent CAD (base)/USD (quote).
Source: Fx Street
I am Joshua Winder, a senior-level journalist and editor at World Stock Market. I specialize in covering news related to the stock market and economic trends. With more than 8 years of experience in this field, I have become an expert in financial reporting.


