
- USD/CAD rebounds to a resistance zone from all-time highs at the top of a long-term range.
- The pair’s strong rally could begin to weaken in the face of firm resistance.
- There are no signs yet of a downward reversal, however, short and medium-term trends remain “bullish.”
USD/CAD reaches the top of a multi-year range and the pair is likely to encounter strong technical resistance at these levels.
USD/CAD Daily Chart
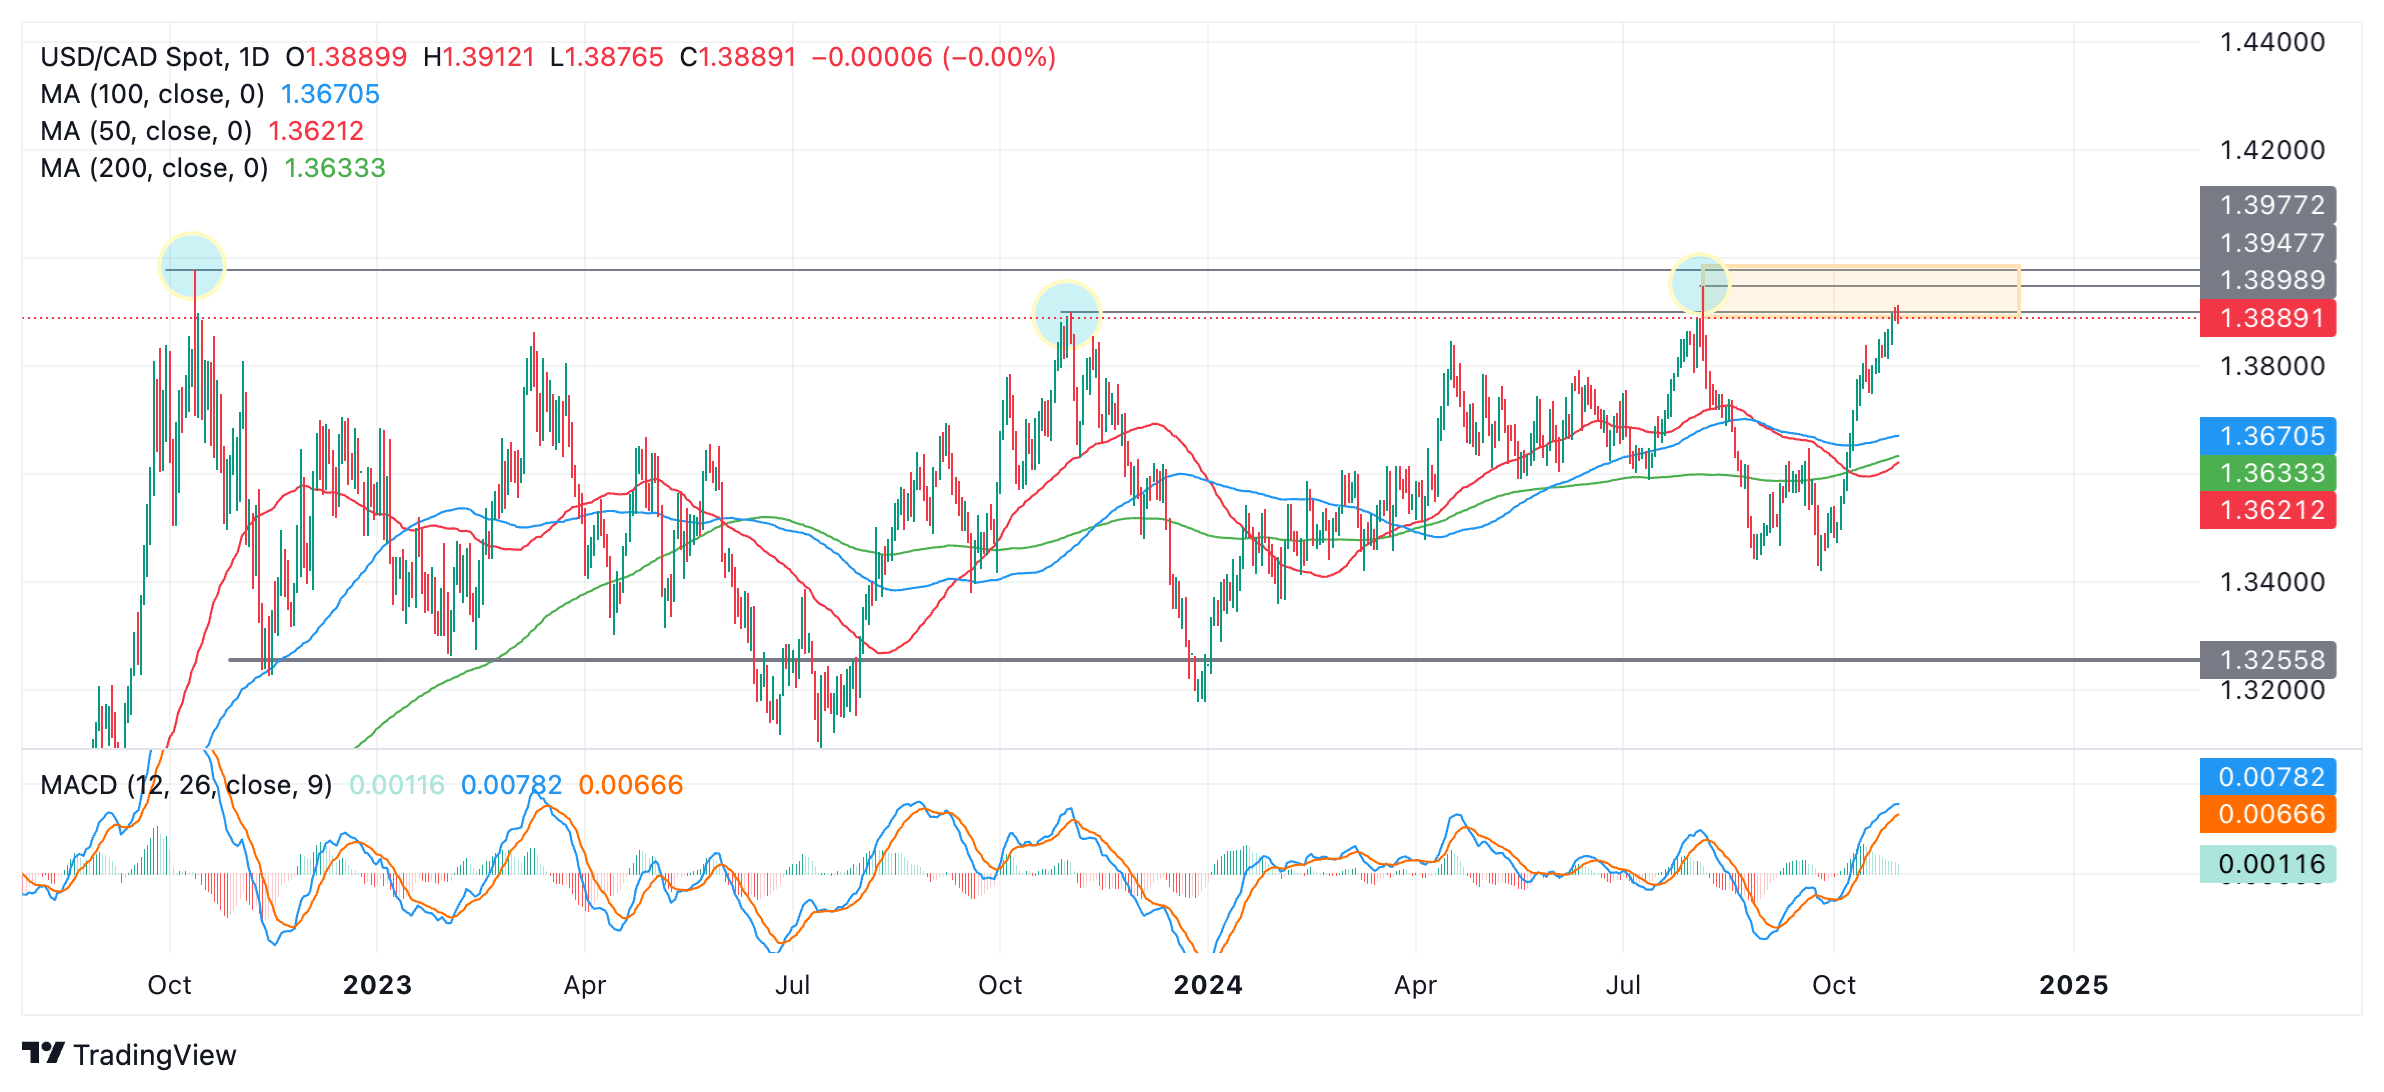
USD/CAD has reached a zone (orange shaded rectangle) at 1.3800s and 1.3900s composed of resistance from all-time highs. These include the August 2024 high, the November 2023 high, and the October 2022 high. The peaks have been highlighted with blue circles in the chart above. They comprise the top of the pair’s long-term lateral range.
It is possible that this marks a turning point for USD/CAD and the price will reverse and begin a fall within its range, however, there are no price signals yet to confirm this. Although the pair has formed two Doji Star candles in a row in the last two days (so far), a long bearish candle would be required to confirm that these are part of a reversal pattern. Such a bearish day has yet to materialize.
Short and medium term trends remain bullish and given the principle that “the trend is your friend”, the odds are in favor of further upside. As such, USD/CAD could continue to rise to the top of the range at 1.3977.
The Moving Average Convergence/Divergence (MACD) momentum indicator is at relatively high levels and is tilting. It looks like it could cross below the red signal line giving a sell signal, but that hasn’t happened yet. If it does, it will be further evidence of a bearish reversal.
Source: Fx Street
I am Joshua Winder, a senior-level journalist and editor at World Stock Market. I specialize in covering news related to the stock market and economic trends. With more than 8 years of experience in this field, I have become an expert in financial reporting.


