
- The USD/CAD quotes vulnerable about 1,3650 while the US dollar sees more disadvantages for a disappointing US economic data series.
- The commercial uncertainty between the US and China also keeps USD at a disadvantage.
- The BLON maintained stable interest rates in 2.75% on Wednesday, as expected.
The USD/CAD pair seems vulnerable about a minimum of more than eight months, slightly above 1,3650 during Thursday’s Asian negotiation hours. The Loonie pair remains under pressure while the US dollar (USD) is still disadvantaged in renewed risks of stagning in the United States (USA) and commercial uncertainty.
The dollar index (DXY), which follows the value of the dollar against six main currencies, quotes with caution about six weeks around 98.60.
On Thursday, the disappointing employment data of the private sector and the purchasing managers index (PMI) of ISM Services for May showed a weakened labor demand, an activity of the Sector Sectors in Declive and an increase in the costs of inputs, a scenario that typically pushes the economy towards a stagflation.
Meanwhile, the commercial uncertainty between the US and China has climbed after President Donald Trump pointed out in a publication in Truth.Social that negotiations with Xi Jinping are a hard bone to gnaw.
In the Canadian economy, the decision of the Bank of Canada (BOC) to maintain stable interest rates in 2.75% and its discouraging comments on any short -term monetary policy adjustment have strengthened the Canadian dollar (CAD). The Boc left its stable key interest rates at 2.75% on Wednesday, as expected.
Canadian dollar today
The lower table shows the change percentage of the Canadian dollar (CAD) compared to the main currencies today. Canadian dollar was the strongest currency against the Japanese yen.
| USD | EUR | GBP | JPY | CAD | Aud | NZD | CHF | |
|---|---|---|---|---|---|---|---|---|
| USD | 0.06% | 0.06% | 0.14% | -0.00% | 0.01% | 0.05% | 0.06% | |
| EUR | -0.06% | 0.05% | 0.10% | -0.03% | -0.04% | -0.07% | 0.03% | |
| GBP | -0.06% | -0.05% | 0.08% | -0.09% | -0.07% | -0.13% | -0.03% | |
| JPY | -0.14% | -0.10% | -0.08% | -0.15% | -0.18% | -0.19% | -0.08% | |
| CAD | 0.00% | 0.03% | 0.09% | 0.15% | -0.02% | -0.04% | 0.06% | |
| Aud | -0.01% | 0.04% | 0.07% | 0.18% | 0.02% | -0.06% | 0.05% | |
| NZD | -0.05% | 0.07% | 0.13% | 0.19% | 0.04% | 0.06% | 0.12% | |
| CHF | -0.06% | -0.03% | 0.03% | 0.08% | -0.06% | -0.05% | -0.12% |
The heat map shows the percentage changes of the main currencies. The base currency is selected from the left column, while the contribution currency is selected in the upper row. For example, if you choose the Canadian dollar of the left column and move along the horizontal line to the US dollar, the percentage change shown in the box will represent the CAD (base)/USD (quotation).
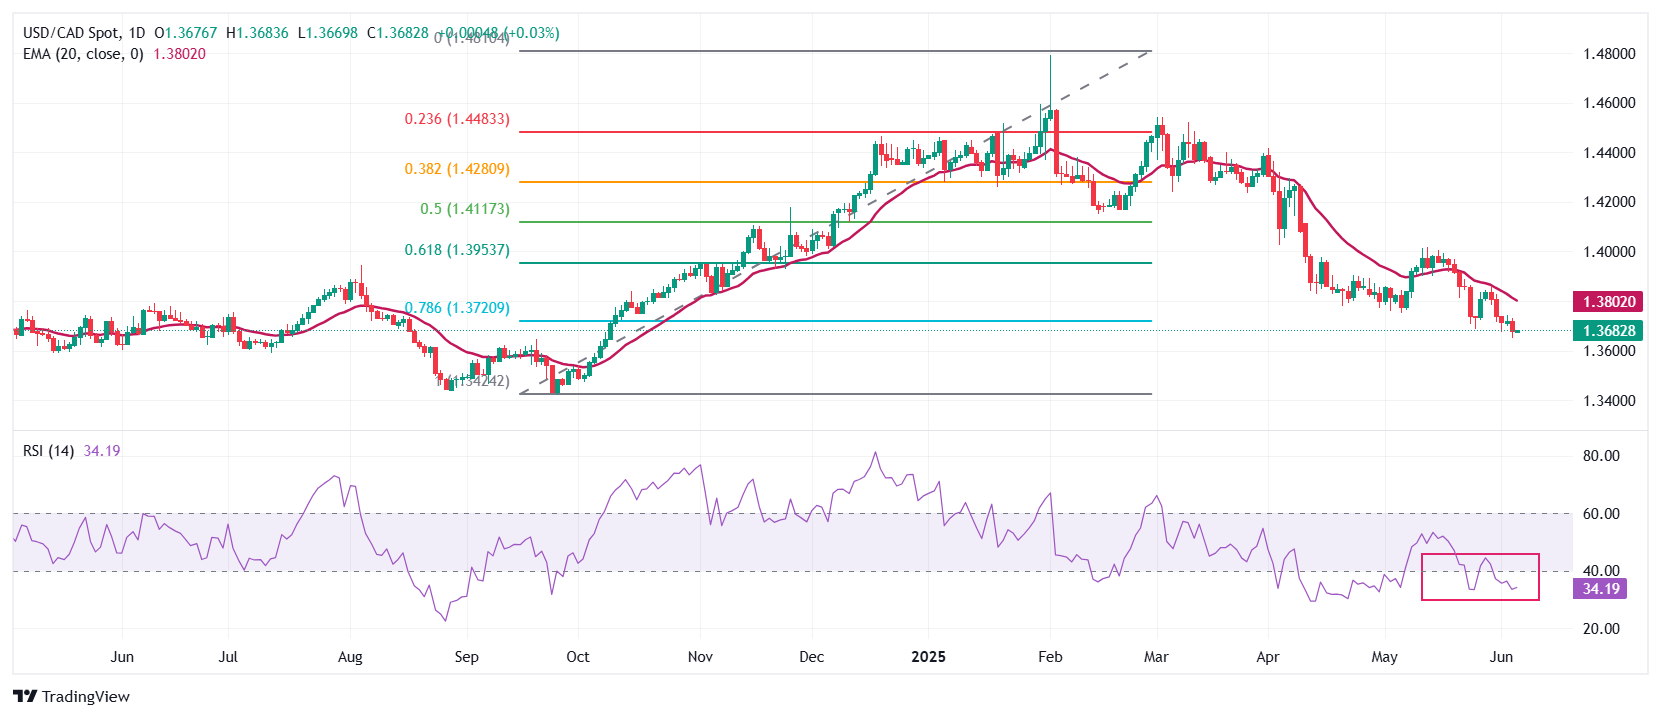
The USD/CA has retreated more than 78.6% of the movement set from the minimum of the end of September around 1,3400 to the maximum of early February about 1,4800. Typically, a setback greater than 61.8% accelerates the downward movement until the end of the movement.
The 20 -day exponential (EMA) mobile average in Declive about 1,3800 reflects that the short -term trend is bassist.
The 14 -day relative force index (RSI) slides about 33.00, indicating a strong bassist impulse.
More disadvantages in the torque seem likely below the minimum of Wednesday of 1,3650, which would drag it towards the round level of 1,3600 and the psychological figure of 1,3500.
In an alternative scenario, a recovery movement above the maximum of May 29, 1,3820 would convert the short -term trend in Alcista and open the door towards the maximum of May 21, 1,3920, followed by the maximum of May 15, 1.4000.
USD/CAD DAILY GRAPH
US dollar FAQS
The US dollar (USD) is the official currency of the United States of America, and the “de facto” currency of a significant number of other countries where it is in circulation along with local tickets. According to data from 2022, it is the most negotiated currency in the world, with more than 88% of all global currency change operations, which is equivalent to an average of 6.6 billion dollars in daily transactions. After World War II, the USD took over the pound sterling as a world reserve currency.
The most important individual factor that influences the value of the US dollar is monetary policy, which is determined by the Federal Reserve (FED). The Fed has two mandates: to achieve price stability (control inflation) and promote full employment. Its main tool to achieve these two objectives is to adjust interest rates. When prices rise too quickly and inflation exceeds the 2% objective set by the Fed, it rises the types, which favors the price of the dollar. When inflation falls below 2% or the unemployment rate is too high, the Fed can lower interest rates, which weighs on the dollar.
In extreme situations, the Federal Reserve can also print more dollars and promulgate quantitative flexibility (QE). The QE is the process by which the Fed substantially increases the flow of credit in a stuck financial system. It is an unconventional policy measure that is used when the credit has been exhausted because banks do not lend each other (for fear of the default of the counterparts). It is the last resort when it is unlikely that a simple decrease in interest rates will achieve the necessary result. It was the weapon chosen by the Fed to combat the contraction of the credit that occurred during the great financial crisis of 2008. It is that the Fed prints more dollars and uses them to buy bonds of the US government, mainly of financial institutions. Which usually leads to a weakening of the US dollar.
The quantitative hardening (QT) is the reverse process for which the Federal Reserve stops buying bonds from financial institutions and does not reinvote the capital of the wallet values that overcome in new purchases. It is usually positive for the US dollar.
Source: Fx Street
I am Joshua Winder, a senior-level journalist and editor at World Stock Market. I specialize in covering news related to the stock market and economic trends. With more than 8 years of experience in this field, I have become an expert in financial reporting.


