- The USD/CAD pair fell to its lowest level since May 11 at 1.3390.
- Investors await the BOC’s decision, which is expected to keep rates at 4.5%.
- Canadian yields rise, supporting the CAD.
He USD/CAD extended its move lower on Tuesday trading in the 1.3389 – 1.3452 range despite the US dollar holding its foot against other pairs, with the DXY index trading with gains at the 104.20 level. Awaiting the Bank of Canada interest rate decision on Wednesday, Canadian yields are rising, giving the Canadian dollar traction.
Canadian yields rise ahead of BOC decision
On Wednesday, investors will be watching the BOC’s interest rate decision, where Governor Tiff Macklem and other policymakers are expected to keep interest rates at 4.5%. In this sense, the clear slowdown in previous inflation figures gives the BoC room to keep rates stable. Additionally, the Canadian Ivey PMI was weak in May, falling back to 53.5 vs. 57.2 expected, supporting no-upside expectations as economic activity shows weakness.
Meanwhile, Canadian bond yields move up the entire curve. The 10-year bond yield rose to 3.33%, while the 2-year yield stands at 4.42% and the 5-year yield stands at 3.57%.
Considering the upcoming Federal Reserve (Fed) decision, according to CME’s FedWatch tool, investors are betting on a 73.6% probability that the Fed will not raise rates at its next meeting in June and will hold the rate. target at 5.25%. However, the decision will largely depend on upcoming consumer price index (CPI) data for May, where headline inflation is expected to slow to 4.2% (yoy) from 4.9%, while the rate core to accelerate to 5.6% (yoy) from the last reading of 5.5%. In this sense, the expectations of the next decision may have an impact on the US dollar.
Levels to watch
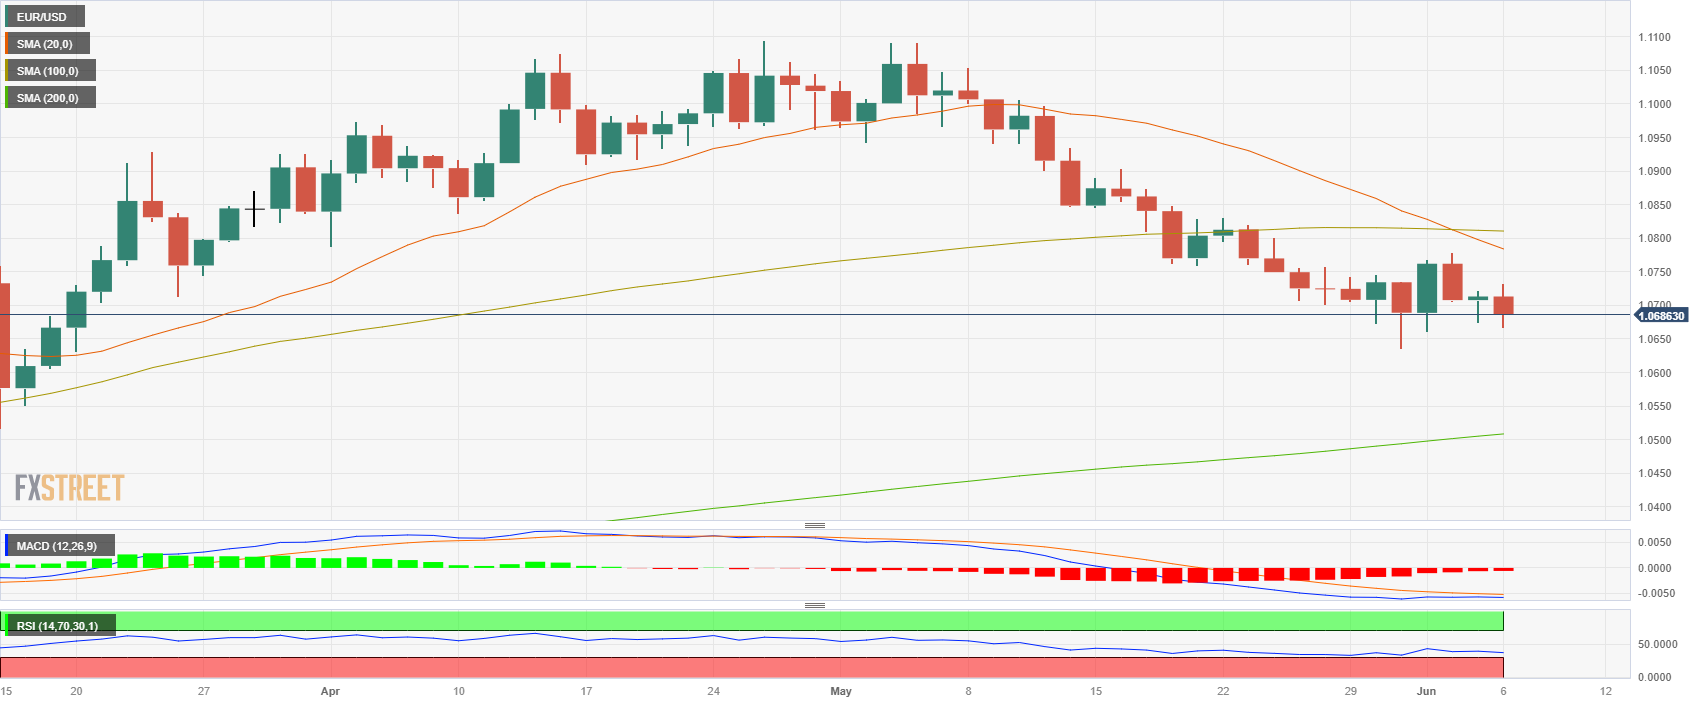
Technically speaking, the USD/CAD maintains a bearish outlook for the short term, according to the indicators on the daily chart. The Relative Strength Index (RSI) and Moving Average Divergence (MACD) are showing weakness and are in negative territory, with the pair trading below its main moving averages, indicating that the sellers have the upper hand. . Shorter-term charts such as the 4-hour chart also suggest bear dominance, with technicals on the downside.
On the downside, the next support levels to watch are the daily low at the 1.3389 zone, followed by the 1.3350 and 1.3335 zones. Elsewhere, a move above the 1.3450 zone could reignite bullish momentum, with next resistances at 1.3470 and the convergence of the 20, 100 and 200 SMAs around the 1.3500 zone.

USD/CAD
| Overview | |
|---|---|
| Last price today | 1.3414 |
| daily change today | -0.0031 |
| today’s daily variation | -0.23 |
| today’s daily opening | 1.3445 |
| Trends | |
|---|---|
| daily SMA20 | 1.3508 |
| daily SMA50 | 1.3502 |
| daily SMA100 | 1.3518 |
| daily SMA200 | 1.3509 |
| levels | |
|---|---|
| previous daily high | 1.3462 |
| previous daily low | 1.3418 |
| Previous Weekly High | 1.3651 |
| previous weekly low | 1.3407 |
| Previous Monthly High | 1.3655 |
| Previous monthly minimum | 1.3315 |
| Fibonacci daily 38.2 | 1.3445 |
| Fibonacci 61.8% daily | 1.3434 |
| Daily Pivot Point S1 | 1.3421 |
| Daily Pivot Point S2 | 1.3397 |
| Daily Pivot Point S3 | 1.3377 |
| Daily Pivot Point R1 | 1.3465 |
| Daily Pivot Point R2 | 1.3486 |
| Daily Pivot Point R3 | 1,351 |
Source: Fx Street
I am Joshua Winder, a senior-level journalist and editor at World Stock Market. I specialize in covering news related to the stock market and economic trends. With more than 8 years of experience in this field, I have become an expert in financial reporting.


