- USD/CAD hits solid resistance and falls back to the lows of 1.3525.
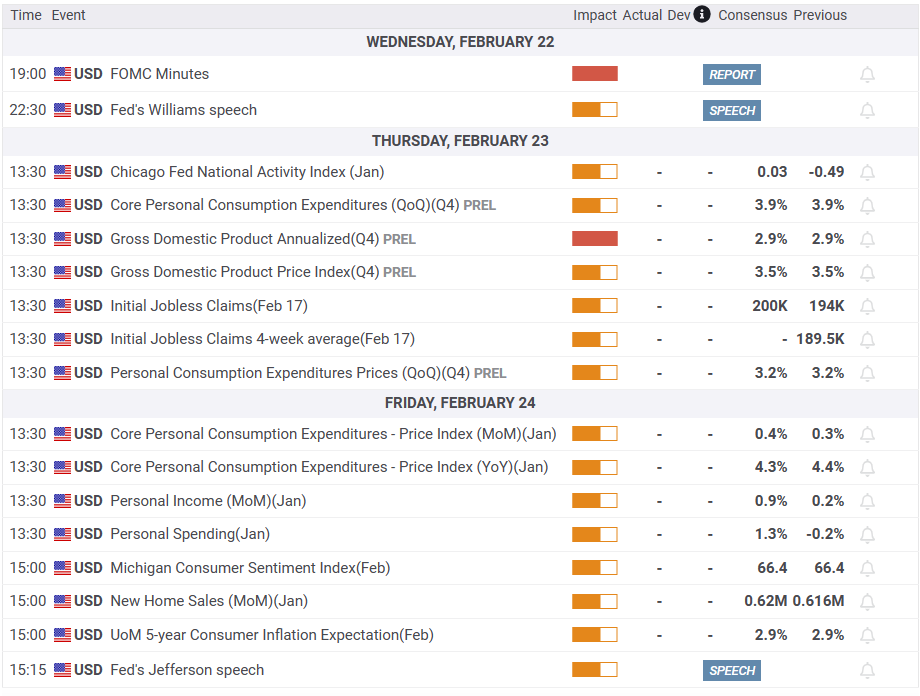
- Traders are awaiting further guidance from the US Federal Reserve.
- If the BOC pauses, the USD/CAD will extend its gains.
The pair USD/CAD hardly changed ahead of FOMC minutes release, albeit slightly lower with 0.05% loss. Traders feared that the Fed would raise rates more than expected, dampening market sentiment over the past two weeks. At the time of writing, USD/CAD is trading around 1.3530.
USD/CAD turns negative, down 0.06%, ahead of FOMC Minutes release
Wall Street bulls take a breather ahead of Fed minutes release. US economic data for the past two weeks justifies the need for further tightening, resulting in a rise in the USD rate /exp. Inflation data in the US slowed, except for the monthly Producer Price Index (PPI) readings, which beat estimates and data from the previous month. In addition, a regional Fed manufacturing index reported in its survey that prices had jumped the most in 10 months, exacerbating reassessment of how far the Fed will go. Worried investors therefore took refuge in the security and bought the US dollar (USD).
As a result, the 10-year US Treasury yield rallied 40 basis points (bp) and supported the dollar.
On the other hand, in Canada there was a cooling of inflation, a signal for the Bank of Canada to pause its cycle of increases. Meanwhile, Canadian New Home Prices fell 0.2% in January from the December data Statistics Canada showed on Wednesday, but the annual rate slowed to 2.7%.
Thus, the USD/CAD broke above 1.3500 after almost two months of sideways trading. However, the pair faced four-month trend line resistance and was rejected after hitting multi-week highs at 1.3560 and falling towards 1.3520.
What is there to watch out for?

USD/CAD Key Technical Levels
USD/CAD
| Overview | |
|---|---|
| Last price today | 1.3528 |
| daily change today | -0.0009 |
| today’s daily variation | -0.07 |
| today’s daily opening | 1.3537 |
| Trends | |
|---|---|
| daily SMA20 | 1,339 |
| daily SMA50 | 1.3466 |
| daily SMA100 | 1.3516 |
| daily SMA200 | 1.3253 |
| levels | |
|---|---|
| previous daily high | 1.3549 |
| previous daily low | 1.3441 |
| Previous Weekly High | 1.3538 |
| previous weekly low | 1.3274 |
| Previous Monthly High | 1.3685 |
| Previous monthly minimum | 1.33 |
| Fibonacci daily 38.2 | 1.3508 |
| Fibonacci 61.8% daily | 1.3483 |
| Daily Pivot Point S1 | 1.3469 |
| Daily Pivot Point S2 | 1.3401 |
| Daily Pivot Point S3 | 1.3361 |
| Daily Pivot Point R1 | 1.3577 |
| Daily Pivot Point R2 | 1.3617 |
| Daily Pivot Point R3 | 1.3685 |
Source: Fx Street
I am Joshua Winder, a senior-level journalist and editor at World Stock Market. I specialize in covering news related to the stock market and economic trends. With more than 8 years of experience in this field, I have become an expert in financial reporting.


