
- The Loonie chains a second consecutive day of losses.
- The dollar lost attractiveness after the agreement on the debt ceiling reached on Sunday.
The pair USD/CAD, at the time of writing these lines, is trading at 1.3590, losing 0.15% during the American session. Following the announcement of the debt ceiling deal on Sunday, market sentiment turned positive and weakened the US dollar, as US traders enjoyed a long Memorial Day weekend. On the other hand, the Canadian economic calendar has nothing relevant to offer and the Canadian dollar benefits from the positive market environment.
Wall Street futures rise amid US debt ceiling deal
US President Joe Biden and Republican House Speaker Kevin McCarthy jointly declared that they have reached a consensus on extending the debt ceiling on Sunday. Under the proposed deal, the government would be allowed to borrow funds without raising the limit; instead, the limit would be temporarily suspended until 2025. However, the proposal still needs to be approved by Congress, but US officials are optimistic about its passage. In reaction, Wall Street futures celebrated the announcement and rose, putting pressure on the US dollar.
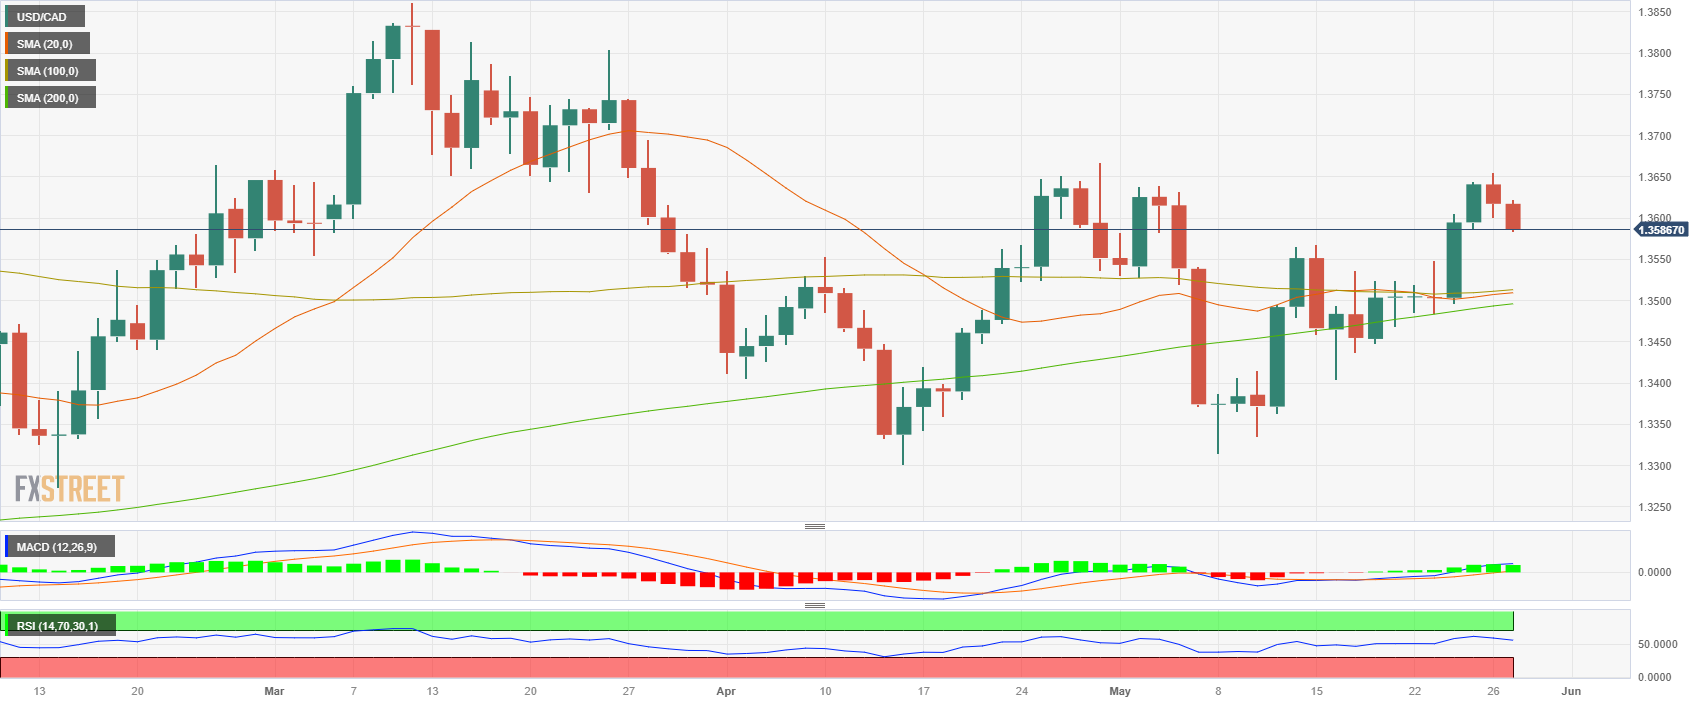
Levels to watch
Based on the daily charts, USD/CAD maintains a neutral to bearish outlook in the short term. However, indicators remain in positive territory and the convergence of the 20 and 100 SMAs at the 135.00 area suggests that the pair could continue to rise.
The 1.3580 zone is the immediate support level for the USD/CAD. A break below this level could pave the way towards the aforementioned convergence at the 1.3500 area. Furthermore, the 1.3620 zone is key for the USD/CAD to continue to gain traction. If broken, we could see a steeper move towards the monthly high at 1.3650 and the key psychological level at 1.3700.
Source: Fx Street
I am Joshua Winder, a senior-level journalist and editor at World Stock Market. I specialize in covering news related to the stock market and economic trends. With more than 8 years of experience in this field, I have become an expert in financial reporting.


