
- USD/CHF has surpassed 0.9200 and registers its highest prices in six months.
- The CHF continues to fall, supported by a moderate SNB.
- The dollar receives support from encouraging data from the United States.
The USD/CHF pair is on track to close in the green for the eleventh consecutive week, while the Dollar rebounds against the Swiss Franc (CHF). US data releases continue to boost the dollar, and rising US Treasury yields due to concerns over a possible US government shutdown are adding fuel to the dollar’s fire.
On the CHF side, the Swiss National Bank (SNB) recently surprised markets with an unexpected freeze on rate hikes, and the SNB’s rate hike cycle appears to have come to an end as inflation falls by below the Swiss central bank’s 2% target and the Swiss national economy continues to show signs of weakness.
Markets rising in the US and falling in Switzerland
US Durable Goods Orders surprised to the upside on Wednesday, with the August headline reading at 0.2%, a nice rebound from the previous 5.6% drop and above the market forecast of -0.5%.
The Gross Domestic Product (GDP) will be published on Thursday, which will remain at 2.1% in the second quarter.
Swiss Retail Sales for the annualized period for August will be published on Friday, which stood at -2.2%, while the personal consumption expenditure price index (CPI) is expected to remain in line with the reading previous 0.2%.
USD/CHF Technical Outlook
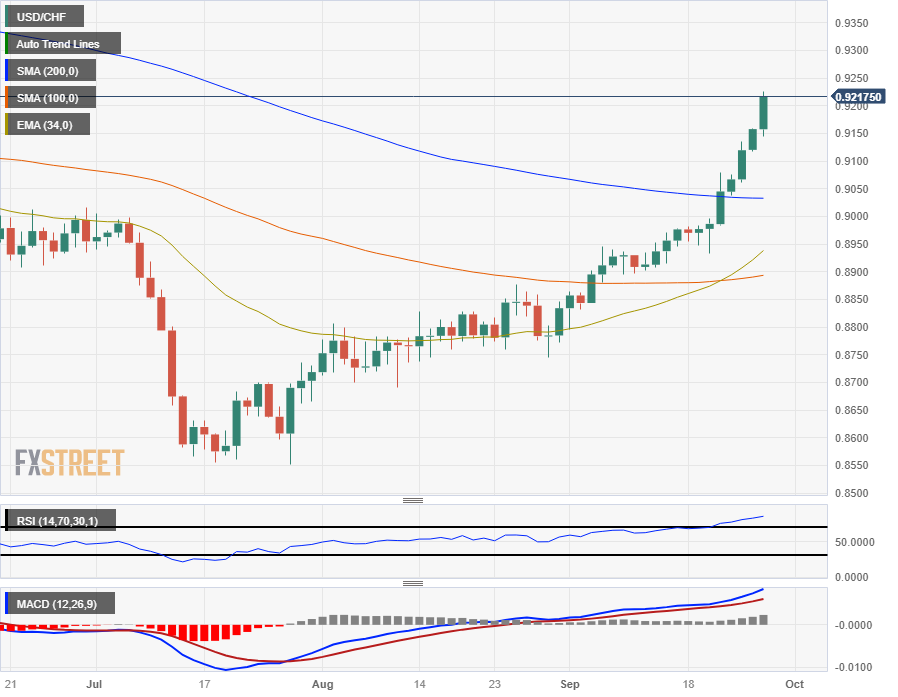
USD/CHF is up almost 8% from July lows near 0.8555, and prices have clearly broken above the 200-day SMA near 0.9050.
The 0.9200 region is an area that plagued USD/CHF with strong consolidation in 2021.
Despite the recent rally on the charts, USD/CHF is still down almost 2.5% on the year, and buyers will have to break the 2023 cap before moving forward any further.
USD/CHF Daily Chart
USD/CHF technical levels
Source: Fx Street
I am Joshua Winder, a senior-level journalist and editor at World Stock Market. I specialize in covering news related to the stock market and economic trends. With more than 8 years of experience in this field, I have become an expert in financial reporting.


