
- USD/CHF fell in the session on Friday, plunging to 0.9016, after rising slightly to 0.9070 earlier in the session.
- With US inflation figures in line with market expectations, markets could be anticipating a less aggressive stance from the Fed.
- The possibility of rate cuts in September has increased slightly.
The pair USD/CHF is trading lower following the release of the latest US inflation data on Friday. This change occurred despite the fact that inflation figures, indicated by the Personal Consumption Expenditure Price Index (PCE), remained stable at 2.7% year-on-year in April, which coincided with market expectations.
On the other hand, the underlying Personal Consumption Expenditure (PCE) Price Index, which excludes volatile food and energy prices, saw an increase of 2.8% year-on-year, consistent with analysts' estimates. What appears to be weakening the USD is the smaller-than-expected monthly change of 0.2%, which was below the 0.3% expected. The odds of relief from the Federal Reserve (Fed), however, remained largely unchanged, except for a slight increase in the probability that the first rate cut will occur in September. Those odds remain low for June and July.
USD/CHF technical analysis
In the daily analysis, the RSI has fallen into negative territory, indicating a change in momentum that favors sellers for the time being. Simultaneously, the MACD Indicator shows red bars, pointing towards increasing bearish momentum.
USD/CHF Daily Chart
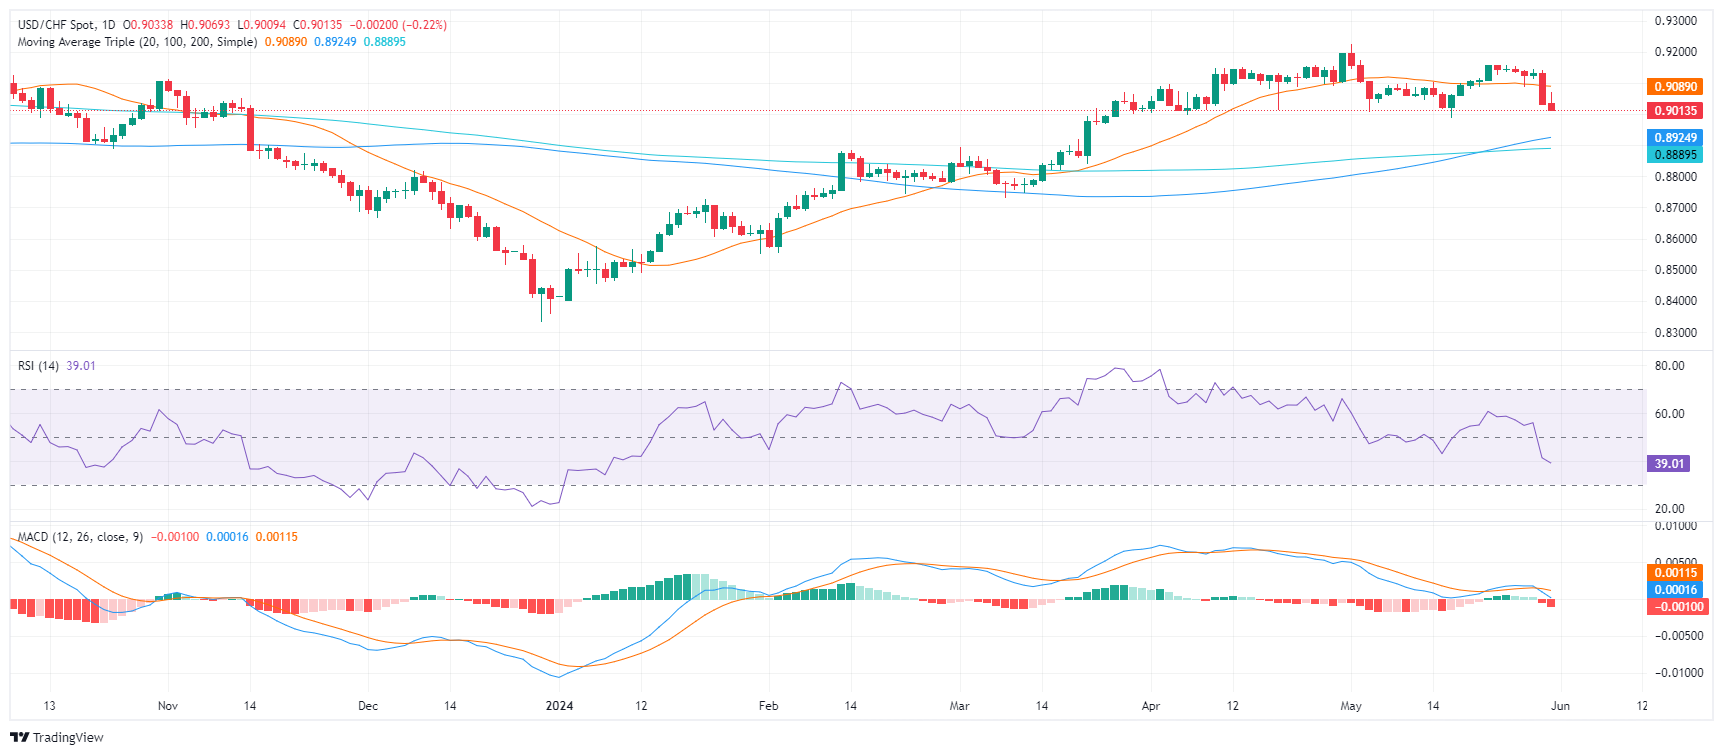
USD/CHF appears to have lost some of its shine from earlier in the week, when it held above the 20-, 100-, and 200-day SMAs. This previous positioning was a strong indicator of an uptrend, with market dominance leaning towards buyers. However, following the recent decline, the pair has lost its position above the 20-day SMA at 0.9095, indicating a less positive near-term outlook.
Source: Fx Street
I am Joshua Winder, a senior-level journalist and editor at World Stock Market. I specialize in covering news related to the stock market and economic trends. With more than 8 years of experience in this field, I have become an expert in financial reporting.


