
- USD/CHF soared to a near three-week high on Tuesday amid broad-based USD strength.
- Risk aversion underpinned the safe haven CHF and capped any significant upside.
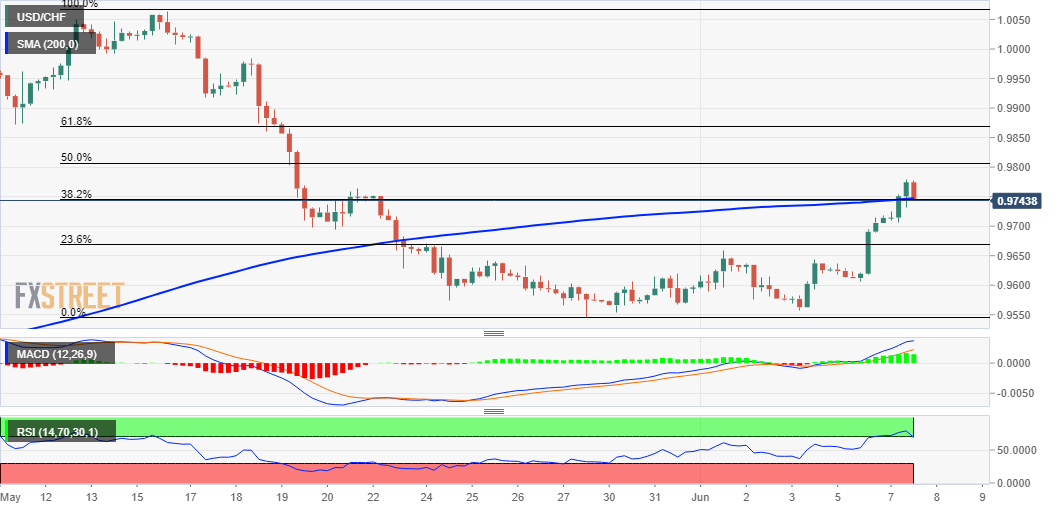
- Acceptance above the 0.9745-0.9750 confluence supports prospects for further gains.
On Tuesday, the pair USD/CHF gained strong follow-up traction for the third day in a row and soared to a nearly three-week high during the early American session. The pair last traded around the 0.9765-0.9770 zone, up more than 0.60% on the day.
The recent rise in US Treasury yields continued to lend support to the US dollar, which, in turn, was seen as a key factor acting as a tailwind for the USD/CHF pair. The bulls were not affected by a softer risk tone, which tends to benefit the Swiss franc, which is a safe haven.
The momentum pushed price through the 0.9745-0.9750 confluence hurdle, which comprises the 200-period SMA on the 4hrs chart and the 38.2% Fib retracement level of the 1.0064-0.9545 decline. This could have already laid the groundwork for a further short-term appreciation move.
With the oscillators on the daily chart just starting to gain positive traction, the USD/CHF pair looks poised to reclaim the 0.9800 level. This level coincides with the 50% Fibonacci level which, if broken decisively, would be considered a new trigger for bulls.
The USD/CHF pair could then accelerate the upside to the 61.8% Fibonacci level test around the 0.9870 region on the way to the next relevant barrier near 0.9900 and the 0.9925-0.9930 zone.
On the other hand, the pullback below the confluence resistance breakout point of 0.9750-0.9745 could now be seen as a buying opportunity and remain capped near the 0.9720-0.9715 region. This is followed by the 0.9700 level, which if broken could change the bias in favor of bearish traders.
USD/CHF 4-hour chart
Technical levels
Source: Fx Street
With 6 years of experience, I bring to the table captivating and informative writing in the world news category. My expertise covers a range of industries, including tourism, technology, forex and stocks. From brief social media posts to in-depth articles, I am dedicated to creating compelling content for various platforms.


